


|
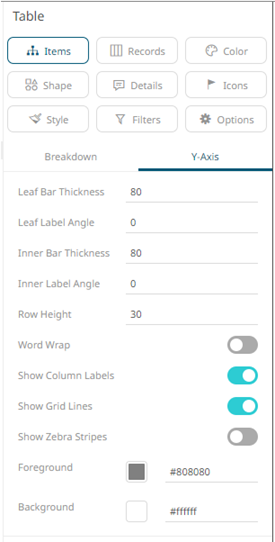
Table Visualization Axis
The Y axis of the Table visualization includes the following settings:
|
Setting |
Description |
|
Leaf Bar Thickness |
The thickness of the leaf or lowest level of data. Default is 80. |
|
Leaf Label Angle |
The Label angle of the leaf or lowest level of data of the crosstab axis. Default is 0, accepts values between -90 and +90. |
|
Inner Bar Thickness |
The width or height allocated for the non-leaf components of the Table axis in pixels. Default is 80. |
|
Inner Label Angle |
The angle of the non-leaf labels. Default is 0, accepts values between -90 and +90. |
|
Row Height |
Defines the height of table rows in pixels. For tables created in versions before 2021.1 the configured “Minimum Interval Length” is used. Default is 30. |
|
Word Wrap |
Determines whether to wrap the visualization axis text. |
|
Show All Column Levels |
Determines whether the space in the text axis should be allocated to all hierarchy levels, whether visible or not. |
|
Show Column Labels |
Determines whether column labels are visible or not. Enabled by default. |
|
Show Grid Lines |
Determines whether grid lines are visible or not. |
|
Show Zebra Stripes |
Determines whether to display alternating row colors (like zebra stripes) in the table. |
|
Foreground |
Foreground color of the Y-axis. |
|
Background |
Background color of the Y-axis. |