


|
Line Graph Settings
Line Graphs are easy to understand and are a great way to communicate important time-based trends, clustering, and outliers.
They work especially well when comparing ten or fewer data sets (our Horizon Graph is a good solution for displaying time series data with ten or more data sets).
The line graph
settings pane is displayed after clicking the Options  button.
|
Setting |
Description |
|
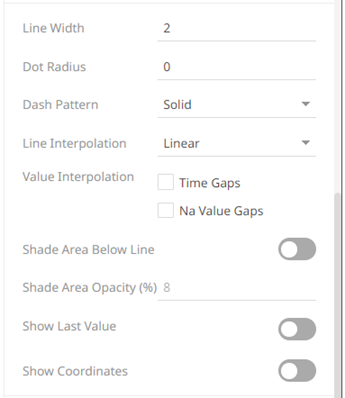
Line Width |
Specifies the line width in pixels. |
|
Dot Radius |
Specifies the radius of each data point in pixels. |
|
Dash Pattern |
Specifies the line pattern. Available options are: · Dotted · Dashed · Solid |
|
Line Interpolation |
Specifies whether the line is Stepped, Linear, or Smooth Interpolation. |
|
Value Interpolation Time Gaps |
Determines whether time axis gaps (Working Week/Time) are interpolated. |
|
Value Interpolation Na Value Gaps |
Determines whether Na value (or missing) gaps are interpolated. |
|
Shade Area Below Line |
Defines that opacity shades are applied between the lines and the zero Y grid line. |
|
Shade Area Opacity (%) |
Specifies the opacity (transparency) of the shaded area, expressed in percent 0-100 of the opacity value currently set on the line. |
|
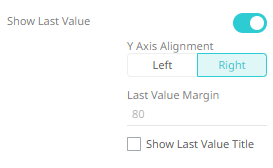
Show Last Value |
Determines if the flag of the last value will be displayed. Once enabled, the Y-Axis Alignment settings section displays.
· Select · Select · Enter the Last Value Margin. Default is 80. · Check the Show Last Value Title box to display the title of the last value in the flag. |
|
Show Coordinates |
Determines whether the graph coordinates (i.e., X-Y plots, or Date/Time-Y plots) on mouse over are displayed in the visualization. |
 to
display Y-axis on the left side.
to
display Y-axis on the left side. to
display the Y-axis on the right side.
to
display the Y-axis on the right side.
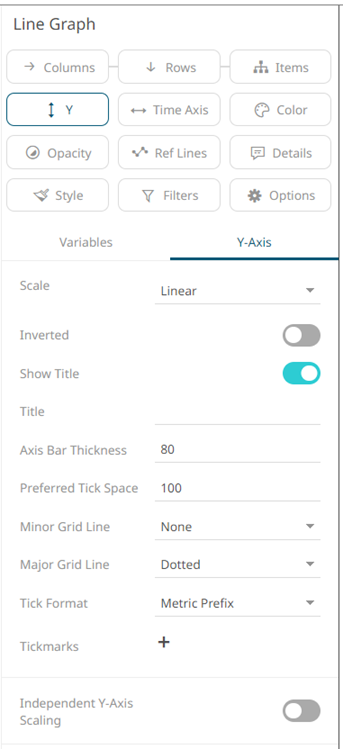
Other visualization-specific properties can be set by clicking on the Y-Axis variable drop area and then selecting the Y-Axis tab:
|
Setting |
Description |
|
Independent Y-Axis Scaling |
Determines whether to have each visualization Y-axis in a cross tab automatically scaled independent of the others. |