|
Toggling Between a Visualization and a Table
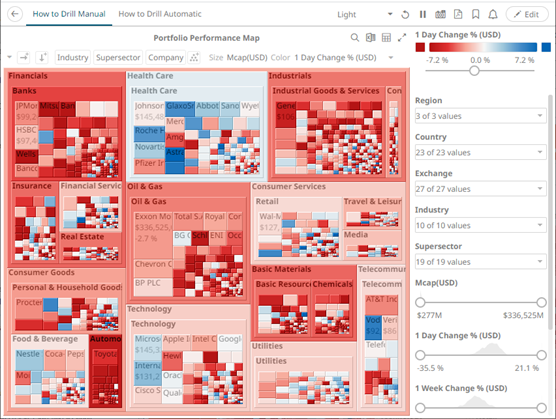
Click the Toggle Display Mode icon of a visualization.
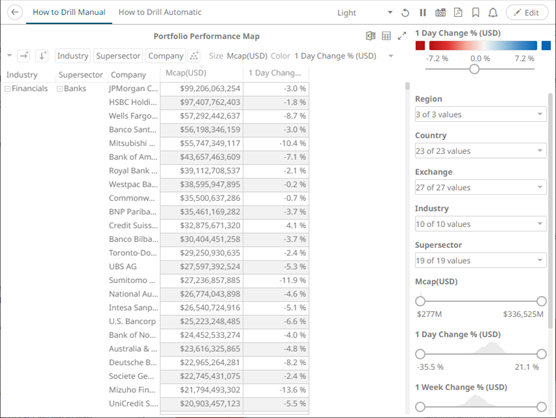
It will be replaced with a Table visualization.
The Table details display the same breakdowns of the original visualization and all the visualization detail variables as visible members of the Table.
|
NOTE |
The Table will default to displaying zebra stripes. |
When the Toggle Display Mode icon is clicked again, the Table will toggle back to the original visualization.
|
NOTE |
· Closing and opening the dashboard will revert to the original visualization. · Changing dashboard tabs will revert to the original visualization. · Applying filters on the dashboard will not cause the Table to be toggled back to a visualization but will display the filtered view of the Table. For example: Industry = Basic Materials and Telecommunications Consequently, toggling back will then display the filtered view of the visualization. The example below will only display Basic Materials and Telecommunications.
|