3D Surface Plot
They provide a clearer understanding of the overall “shape” of the surface but they also introduce occlusion problems; not all data points can be seen due to the display perspective.
The Surface Plot 3D is made up of a series of points where each point has:
- X Position
- Y Position
- Z Position (encoded by color)
The Surface Plot 3D can support data sets where the X and Y positions can both be regular and irregular in their distribution.
The color scale can be continuous or stepped to show a surface gradient.
Grid lines, a ground plane, and markers for data points can be shown if required.
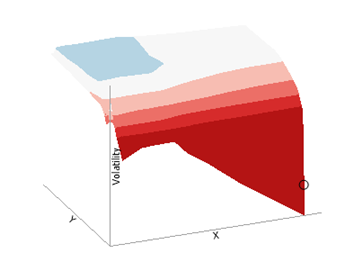
Figure 4-57. A 3D surface plot with stepped colors.
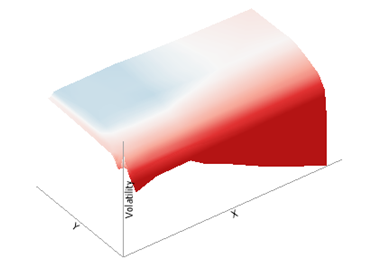
Figure 4-58. A 3D surface plot with continuous colors.
(c) 2023 Altair Engineering Inc. All Rights Reserved.