Bullet Graph
Research has shown that Bullet Graphs are easier to interpret in less time than the radial gauges or speedometers often seen in BI dashboards.
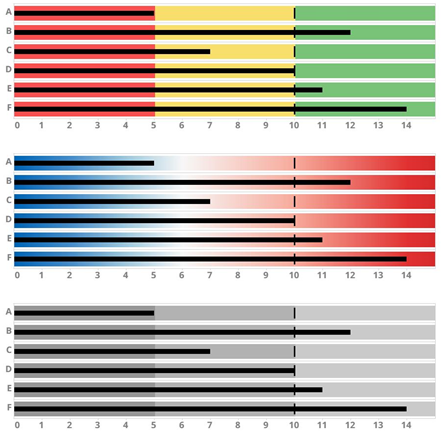
Figure 4-5. A stacked bar graph showing a tornado chart layout.
(c) 2023 Altair Engineering Inc. All Rights Reserved.