Horizon Graph
Our Horizon Graph visualization is particularly useful when you need to see a large number of time series on a single screen. This makes it easy to compare trends and spot patterns that would be very difficult or impossible to see in a standard report.
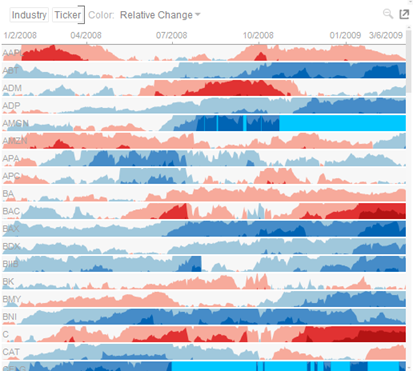
Figure 3-3. A horizon graph.
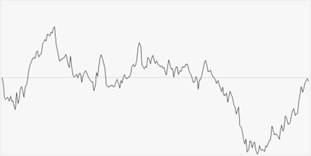
Figure 3-4. Starting with a Line graph.
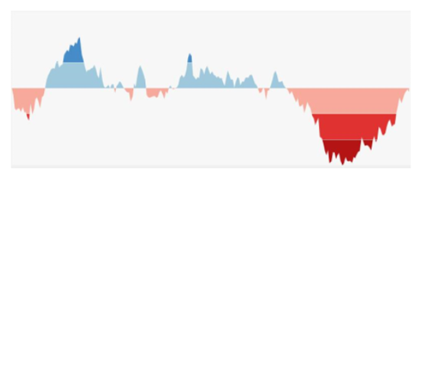
Figure 3-5. Creating color performance bands.
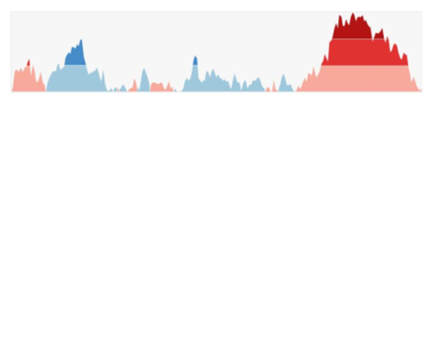
Figure 3-6. Inverting negative regions.
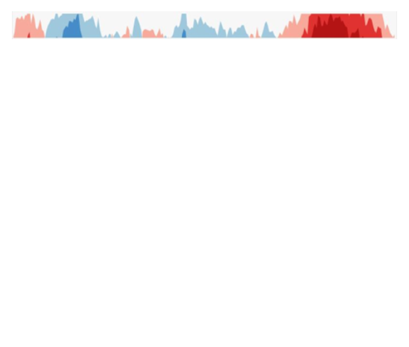
Figure 3-7. Collapsing the performance bands.
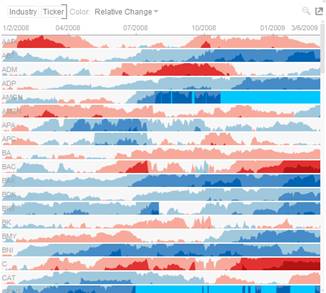
Figure 3.8. A horizon graph is finally created.
(c) 2023 Altair Engineering Inc. All Rights Reserved.