Network Graph
The Network graph supports a two-level breakdown defining the “From”, and “To”, where each node (vertex / point), is either in the “From”, or “To” levels of the breakdown, and each edge (or line), represents the data specific to this “From à To” relationship.
The size of the node is specific to the number of interactions / relationships it has with other nodes. There can be up to two lines connecting two nodes, which can display arrows to show direction; and represent the “From à To” combinations. For example, A à B, and B à A. Each line can also be colored to map to a numeric variable.
Customers use network graphs for investigating correlations, transactional flows, latency, and throughput bottlenecks.
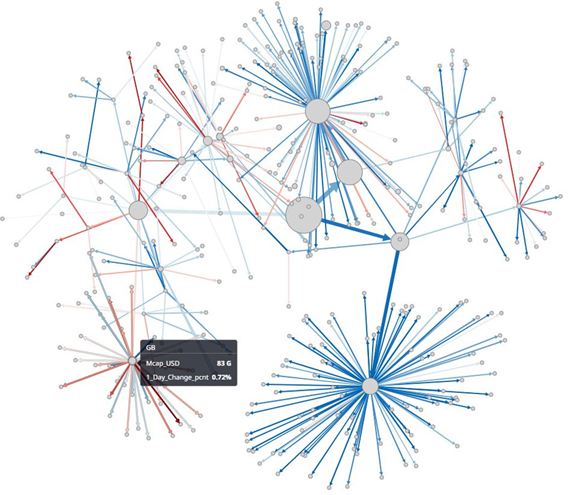
Figure 4-35. A Network Graph displaying clusters/groups and utilizing color and size.
(c) 2023 Altair Engineering Inc. All Rights Reserved.