OHLC Graph
they display:
- Opening Price
- Highest Price
- Lowest Price
- Closing Price
Similar to the Candlestick Graph, a vertical line defines the range of traded prices across the period. However, in this case, the left notch determines the opening price and the right notch determines the closing price.
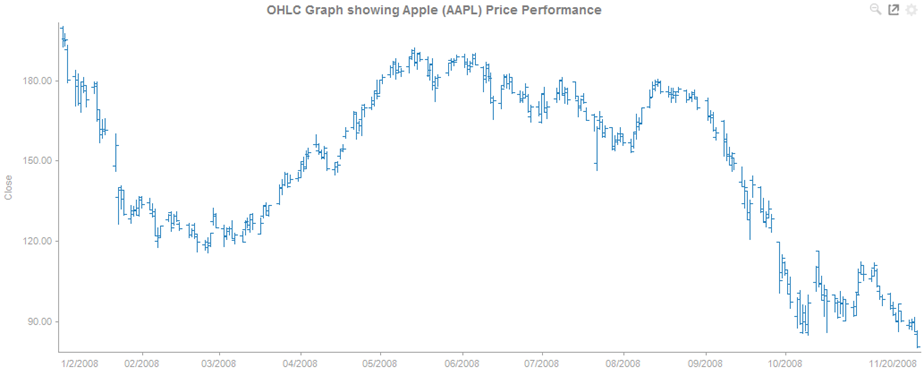
Figure 3-18. An OHLC graph.
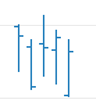
Figure 3-19. Close up of data points in an OHLC graph.
(c) 2023 Altair Engineering Inc. All Rights Reserved.