Surface Plot
The Surface is made up of a series of points where each point has:
- X Position
- Y Position
- Color (which represents the Z-Axis)
The Surface Plot can support data sets where the X and Y positions can both be regular and irregular in their distribution.
Additionally, the color scale can be continuous or stepped to show a surface gradient.
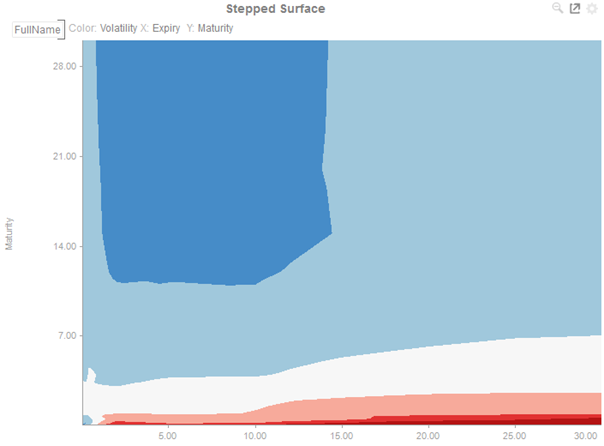
Figure 4-55. A surface plot with stepped colors.
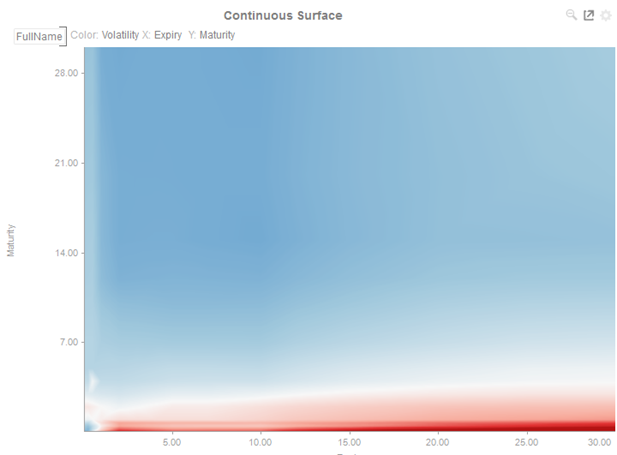
Figure 4-56. A surface plot with continuous colors.
(c) 2023 Altair Engineering Inc. All Rights Reserved.