


|
General
All of the visualizations have these general settings:
|
Property |
Description |
|
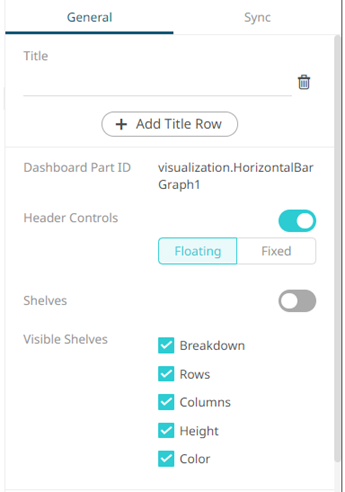
Title of the visualization. Can be more than one displayed in multiple rows. |
|
|
Click to add more title rows. Settings for each title row can be done in the Style section. |
|
|
Dashboard Part ID |
The ID of the dashboard part. |
|
Displays header controls such as Export Excel, Toggle Display Mode, Maximize, Rubber Band Zoom, and Rubber Band Selection. Can either be Floating (default), Fixed, or disabled. |
|
|
Shelves |
Tap the slider to display the Shelf Variable and Breakdown. |
|
Visible Shelves |
Check the boxes of the shelves that will be displayed in the visualization. |
|
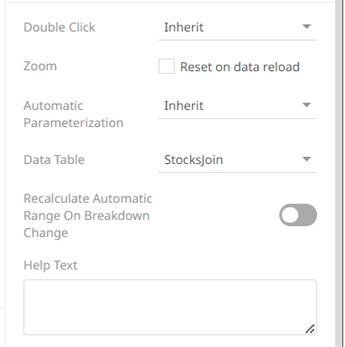
Sets the behavior to be performed when double-clicking on a visualization value. |
|
|
Zoom |
Enable to reset the zoom on data reload. |
|
Select the automatic parameterization status: On, Off, or Inherit (default). |
|
|
Allows you to switch to another data table in the workbook to be used in the visualization. |
|
|
Recalculate Automatic Range on Breakdown Change |
Tap the slider for variables with automatic range/mapping to be recalculated when the visible depth is changed in the visualization. |
|
The added Help text can be displayed for the visualization. |