Design Sensitivity - Study
Perform a linear projection response study after plotting the design sensitivity curves.
- Frequency range
- Indicates the available range, based on your dsa.0.h3d file.
- Type
- The type of response study.
- % DESVAR change
- Optional field that allows you to select a percentage of the design variables to study their combined effect on the response. Design variables of positive sensitivities will be reduced by the specified percentage, while those of negative sensitivities will be increase by the specified percentage.
- Select design variable
- Select the design variable that you want to change in the response
study.
- Click
 to select the entire list of
contributors.
to select the entire list of
contributors. - Click
 to deselect your current
selections.
to deselect your current
selections. - Click
 exchange the currently selected
contributors for the unselected contributors in the list.
exchange the currently selected
contributors for the unselected contributors in the list. - Click
 to select the design variables of
the highest sensitivity from the last Bar plot.
to select the design variables of
the highest sensitivity from the last Bar plot.
- Click
- Display Options
- Customize the response study plot, including scale, weighting, and the plot layout.
- Display
- Display the response study plot once your selections are complete.
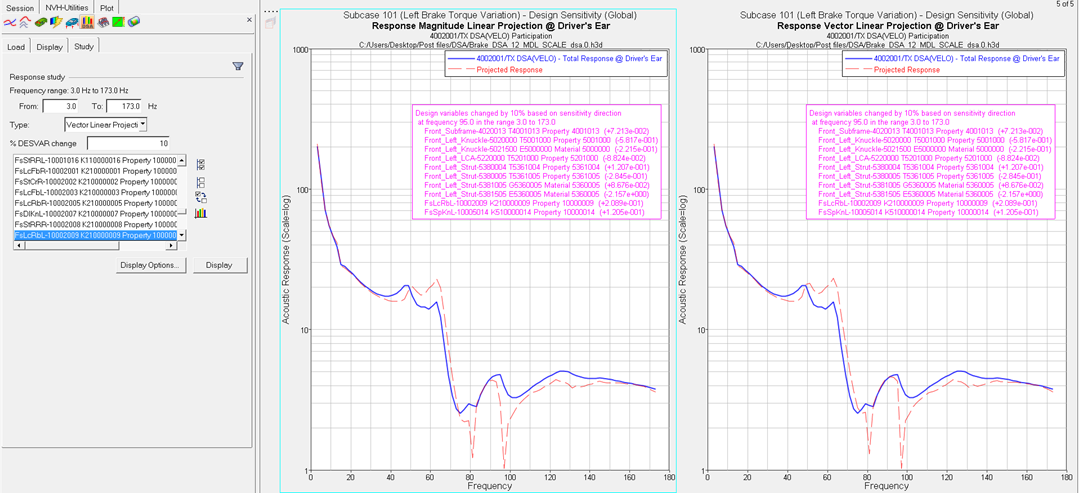
Figure 1. Response study plots