Sensitivity
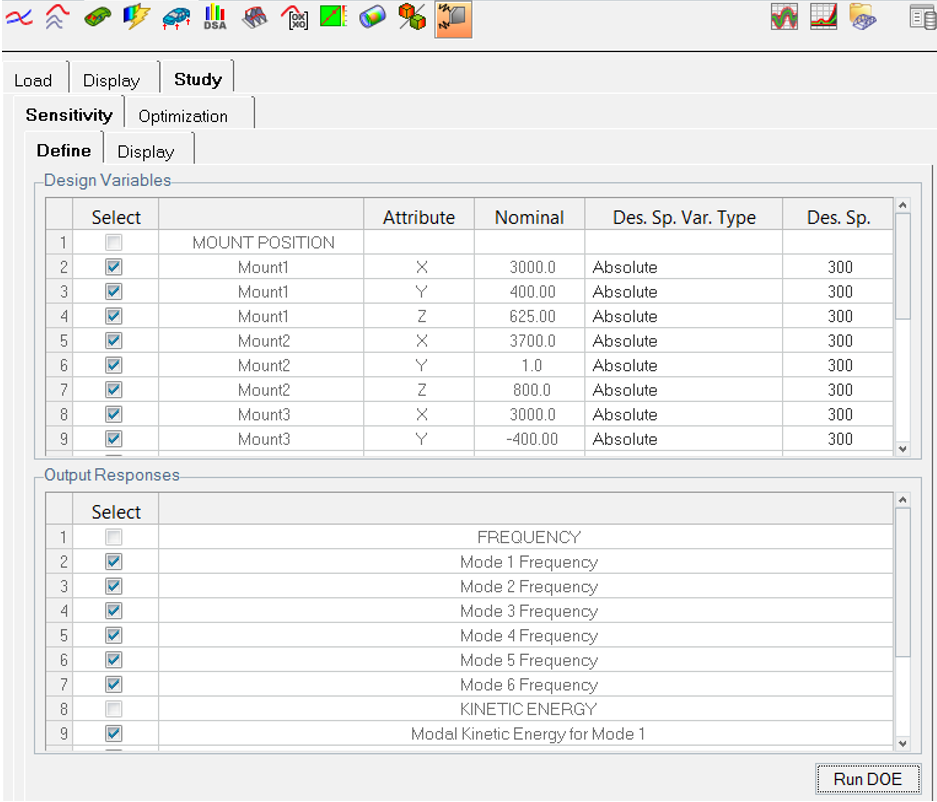
Define design variables and output responses to set up and execute design of experiments (DOE).
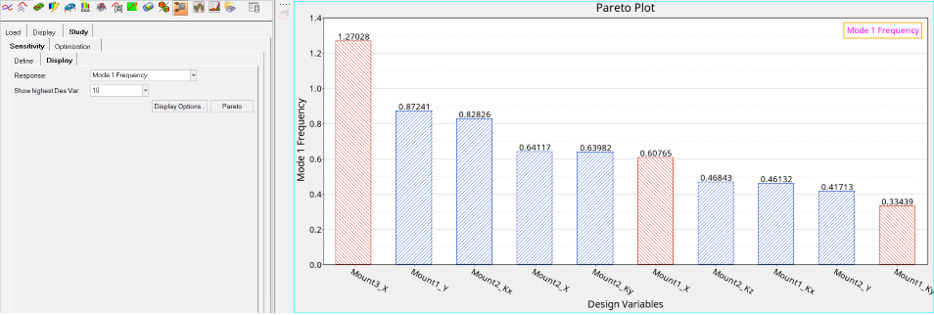
Pareto plots display sensitivity of variables to different output responses.
View new features for HyperMesh NVH 2023.1.
Learn the basics and discover the workspace.
Discover NVH functionality with interactive tutorials.
Learn how to create, open, import and save models.
Set up the simulation model, materials, domains and boundaries.
Create, organize and manage the CAE parts.
Define radiation conditions and create emissivity models.
Calculate a response, perform contribution analysis, plot results, and perform diagnostic studies and study response changes.
Plot modal/panel participation curves from an OptiStruct .h3d file or an MSC Nastran .f06/.pch file.
The Grid Participation utility allows you to plot panel grid participation results and then use advanced scaling contour capabilities to isolate key contributing areas.
Visualize the distribution of energy within a full vehicle NVH model, as a way to understand what components are dominating the vehicle response.
Identifies the complex contribution of the excited structure through attachment points to a response in the responding structure.
Design sensitivity represents a change in response with respect to a change in a design variable, which is typically used for optimization.
Generates and post-processes engine order related data from an OptiStruct or Nastran frequency response analysis that contains either RPM-based loading subcases or order-based loading subcases.
Calculate a frequency response based on modal results.
The Model Correlation utility determines the degree of similarity or correlation between two sets of results.
The Equivalent Radiated Sound utility post-processes the results of exterior structure-borne radiated sound.
Identifies global modes from an OptiStruct or Nastran modal analysis.
The General Signal Processing utility processes the time domain pressure results from CFD simulations and visualizes the results in both the time and frequency domain.
Post-process the pressure result of a vehicle panel obtained from ultraFluidX.
Predicts powertrain rigid body mode frequencies and kinetic energy distribution, which play a critical role in optimizing the mount stiffness and layout configuration, by decoupling powertrain rigid body modes and reducing vibration transmission.
Enter the powertrain and mounting configuration data manually or load the data from a configuration file. Mount stiffness can be static or non-linear.
Review rigid body mode frequencies and corresponding kinetic energy distribution. Right-click on the context menu to display and visualize rigid body modes.
Perform sensitivity studies for mount position and stiffness. You can also perform an optimization setup to calculate the optimized mount stiffness and location layout for decoupling powertrain rigid body modes and frequency spacing.
Define design variables and output responses to set up and execute design of experiments (DOE).
Set up a deterministic optimization and execution defining the objective of decoupling rigid body modes, creating constraints for rigid body mode frequencies, and specifying design space for variables in terms of mount stiffness, locations, and inclinations.
Set up a reliability-based optimization (RBDO) and execution by defining objective of decoupling rigid body modes, creating constraints for rigid body mode frequencies and specifying design space for variables in terms of mount stiffness, locations, and inclinations.
Optimizes sensitive parameters for multiple sample analysis results using the RBDO or Deterministic approach.
Post-process results from a Multiple Sample Analysis, including plotting a spread of responses (+/-95% and mean).
Reads results from an OptiStruct optimization run and processes the results to review the overlay of the NVH responses, baseline versus optimized. Compare changes in the design variable values, baseline versus optimized.
Customize plots using the following options
Filters contributors to a smaller set of data.
Define radiation conditions and create emissivity models.
Predicts powertrain rigid body mode frequencies and kinetic energy distribution, which play a critical role in optimizing the mount stiffness and layout configuration, by decoupling powertrain rigid body modes and reducing vibration transmission.
Perform sensitivity studies for mount position and stiffness. You can also perform an optimization setup to calculate the optimized mount stiffness and location layout for decoupling powertrain rigid body modes and frequency spacing.
Define design variables and output responses to set up and execute design of experiments (DOE).
Pareto plots display sensitivity of variables to different output responses.
© 2023 Altair Engineering, Inc. All Rights Reserved.
Intellectual Property Rights Notice | Technical Support | Cookie Consent