Pareto Plot Post Processing
Plot the effects of input variables on output responses in hierarchical order (highest to lowest).
Plot the Effects of Variables on Responses in Hierarchical Order
Rank the effects of input variables on output responses in hierarchical order (highest to lowest) in the Pareto Plot post processing tab.
-
Using the Channel selector, select the response to plot.
Tip: Analyze multiple responses simultaneously by switching the Multiplot option to
 (multiple plots)
and selecting the responses to plot using the Channel Selector.
(multiple plots)
and selecting the responses to plot using the Channel Selector.
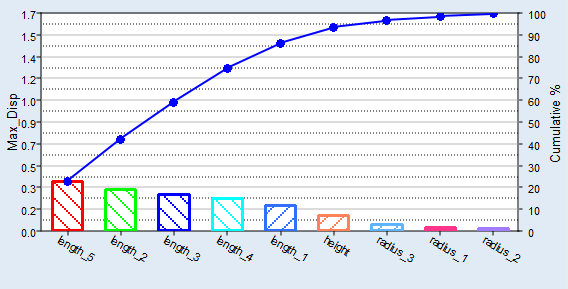
Figure 1.
Pareto Plot Tab Settings
Settings to configure the plots displayed in the Pareto Plot post processing tab.
Access settings from the menu that displays when you click  (located above the Channel selector).
- Effect curve
- Show line to represent the cumulative effect.
- # Top factors displayed
- Specify the number of input variables (bars) displayed in the
plot.Note: This setting does not change the calculated effects.
- Multivariate Effects
- Calculate the effect using all input variables simultaneously.
- Linear Effects
- Calculate the effect using each input variable independently.
- Include Interactions
- Include first order, two way interactions along with first order effects, and calculate interactions consistently with the choice of linear or multi-variate effects.
- Exclude dependent/linked inputs
- Only show the independent input variables.Tip: Excluding dependent/link inputs reduces redundant information.