OS-T: 1305 Modal Frequency Response Analysis of a Flat Plate
This tutorial demonstrates how to import an existing FE model, apply boundary conditions, and perform a modal frequency response analysis on a flat plate.
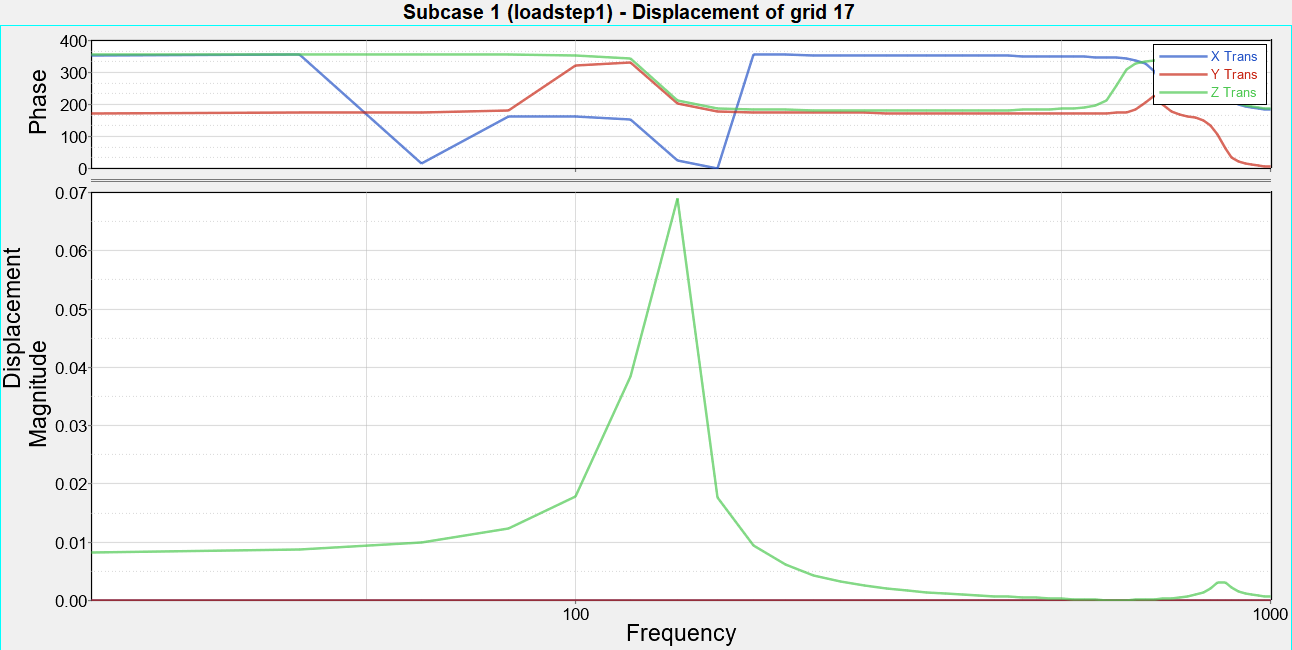
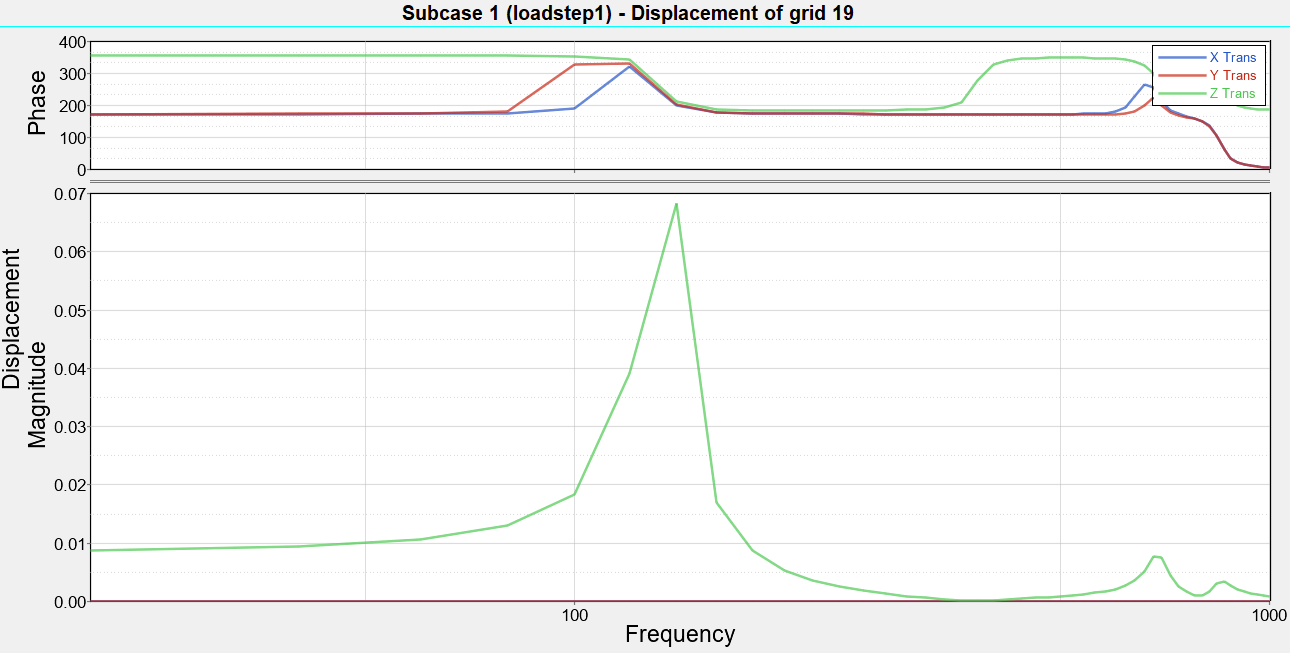
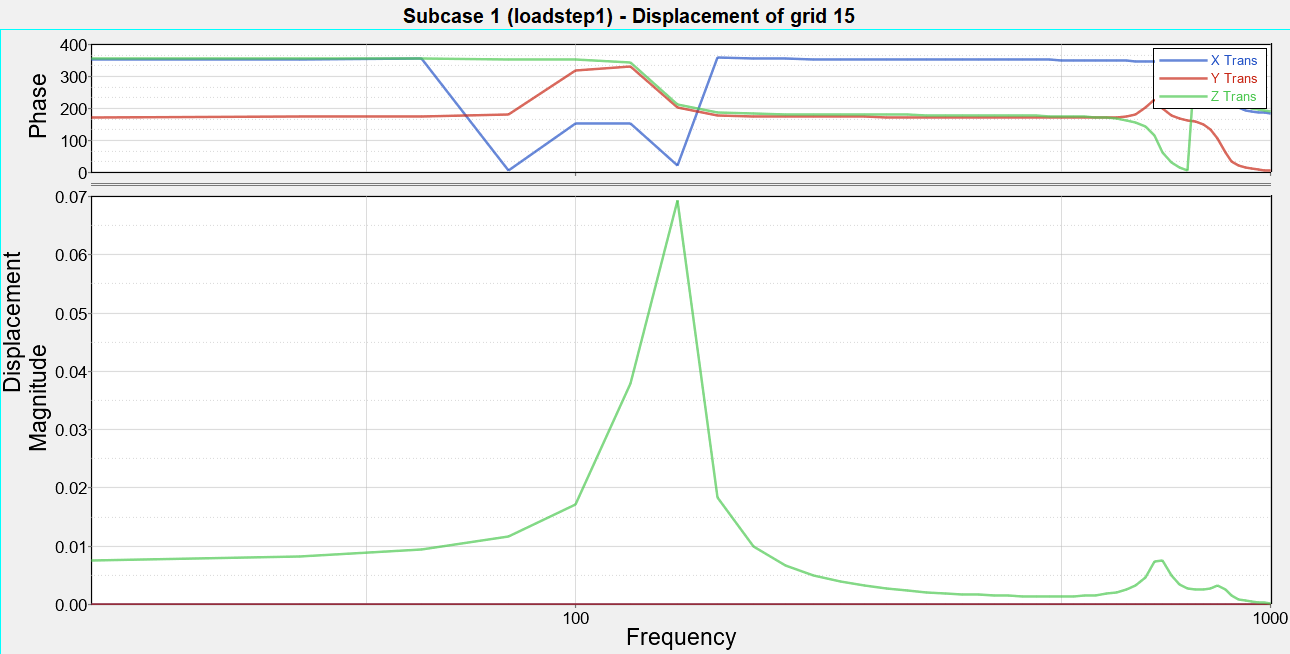
The flat plate is subjected to a frequency varying unit load excitation using the modal method. Post-processing tools will be used in HyperView and HyperGraph to visualize deformations, mode shape response, and frequency-phase output characteristics.
Launch HyperMesh and Set the OptiStruct User Profile
Import the Model
Set Up the Model
Apply Loads and Boundary Conditions
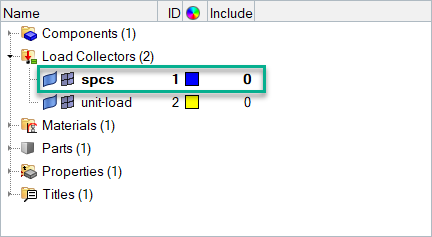
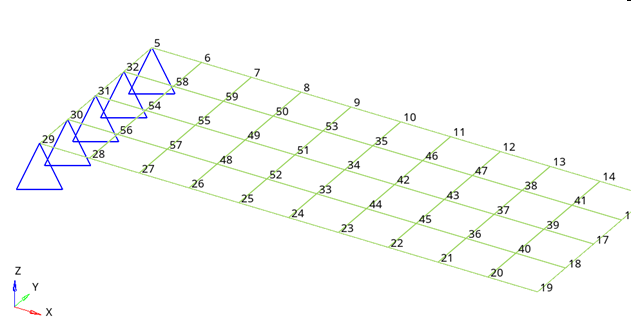
Create Constraints
Create a Unit Load at a Point on the Flat Plate
Create a Frequency Range Table
Create a Frequency Dependent Dynamic Load
Create a Set of Frequencies
Create the Modal Method for Eigenvalue Analysis
Create a Load Step
Create a Set of Nodes
- In the Model Browser, right-click and select .
- For Name, enter SETA.
- For Card Image, select None.
- Leave the Set Type switch set to non-ordered type.
- For Entity IDs, select Nodes from the selection switch.
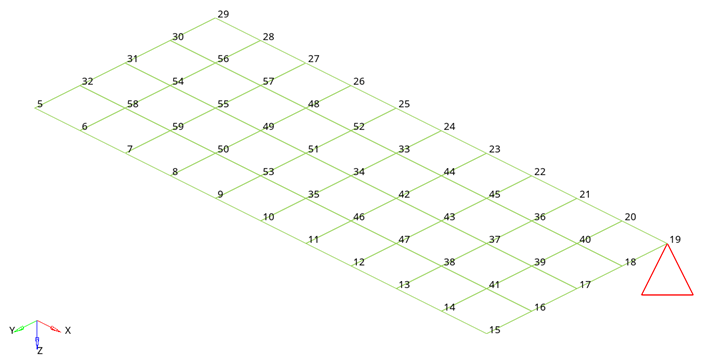
- Click Nodes and select nodes with IDs 15, 17 and 19.
- Click proceed.
Create a Set of Outputs and Mass Factors
Submit the Job
- flat_plate_modal_response.html
- HTML report of the analysis, providing a summary of the problem formulation and the analysis results.
- flat_plate_modal_response.out
- OptiStruct output file containing specific information on the file setup, the setup of your optimization problem, estimates for the amount of RAM and disk space required for the run, information for each of the optimization iterations, and compute time information. Review this file for warnings and errors.
- flat_plate_modal_response.h3d
- HyperView binary results file.
- flat_plate_modal_response.res
- HyperMesh binary results file.
- flat_plate_modal_response.stat
- Summary, providing CPU information for each step during analysis process.
 .
.  to open
the Numbers panel.
 . Select
 .
. 