Network Analysis (Eye-diagram)
-
Select the net, MUC_HOST_USB+.
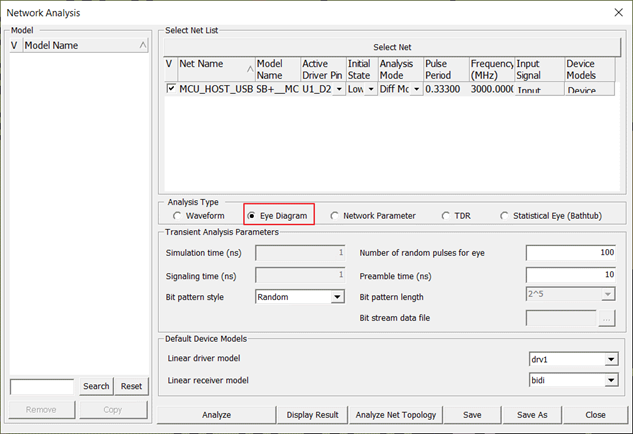
Figure 1. -
Click Analyze.
After the simulation, Waveform Viewer dialog displays.
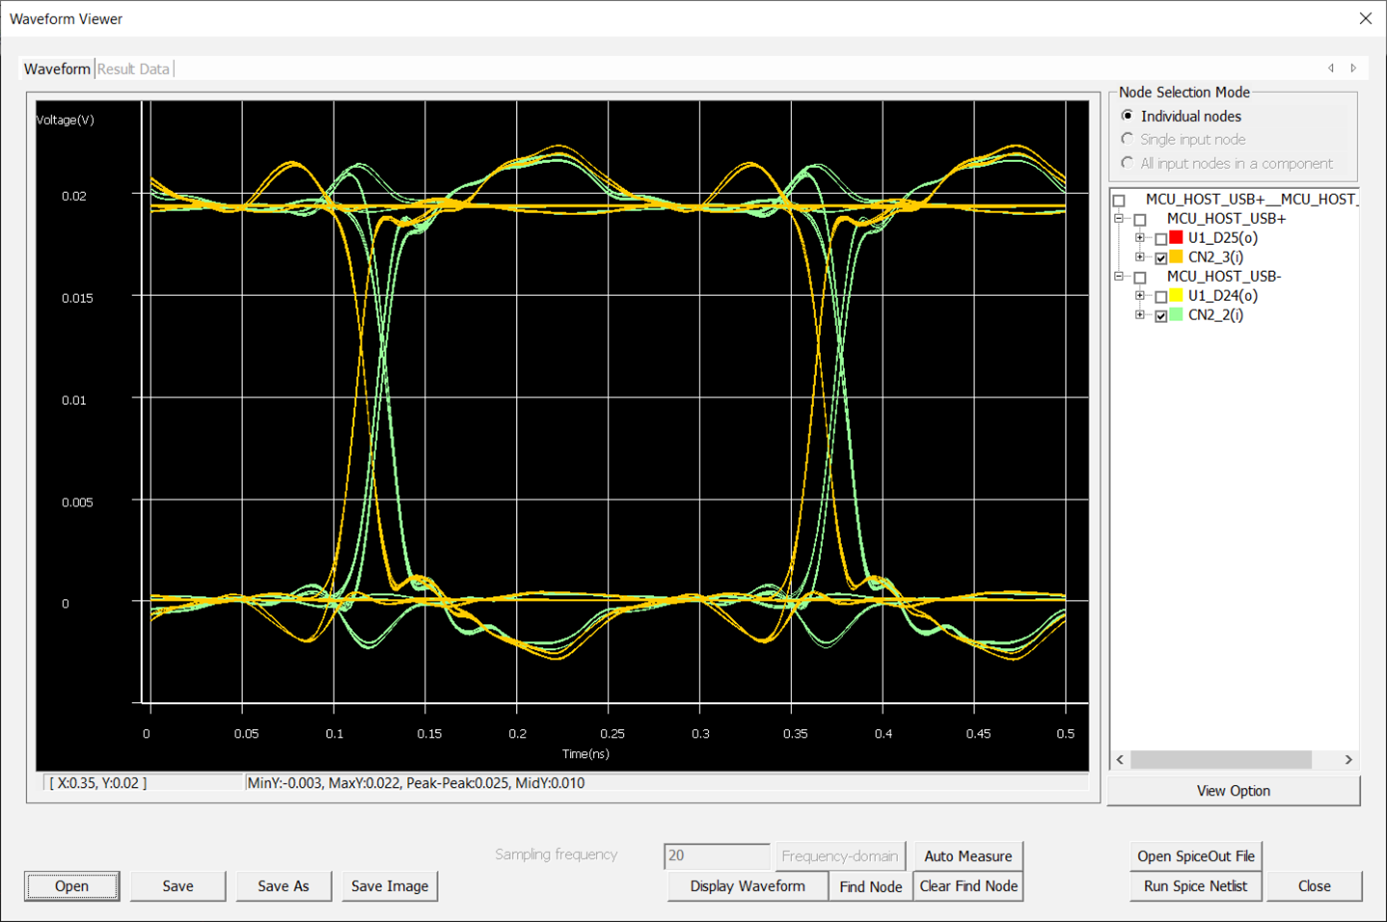
Figure 2.This is an eye diagram representing 100 bits accumulated in a period. It shows the automatically selected Rx-side differential lines, CN2_2(i) and CN_3(i).