SS-V: 1140 Stress Concentration of Filleted Bar
Test No. VS15 Find maximum normal stress for two configurations of a filleted bar.
Definition
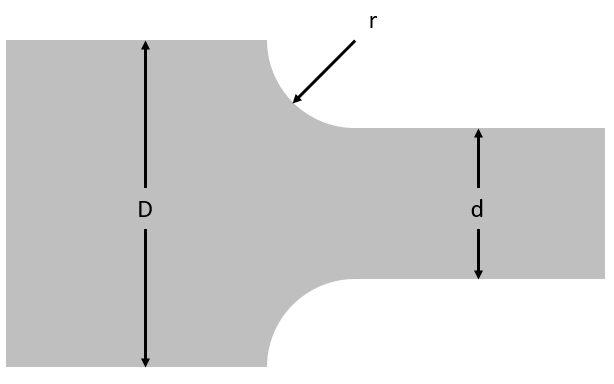
Figure 1.
Stress concentration is given by:(1)
The following table outlines the two configurations of the loads on the bar.
| Dimension | Configuration 1 | Configuration 2 |
|---|---|---|
| D | 33 mm | 45 mm |
| d | 30 mm | 30 mm |
| r | 1.5 mm | 6 mm |
| t | 2 mm | 2 mm |
| D/d | 1.10 | 1.50 |
| r/d | 0.05 | 0.20 |
| Kt | ~2 | ~1.75 |
The material properties are:
- Properties
- Value
- Modulus of Elasticity
- 2.1e+11 Pa
- Poisson's Ratio
- 0.3
Results
Run SimSolid analysis with 3 adaptive passes, Adapt to features and thin
solids on. The following table summarizes the stress results.
| Reference | SimSolid | % Difference | |
|---|---|---|---|
| Max Prin. Stress - Configuration 1 | 2.00 | 2.04 | 2.00% |
| Max Prin. Stress - Configuration 2 | 1.80 | 1.84 | 2.22% |
1 Shigley’s Mechanical
Engineering Design, Appendix A, Figure A-15-5, McGraw Hill, 2016