Test No. VNL05 Find residual deformations in a bar
axially loaded beyond plasticity.
Definition
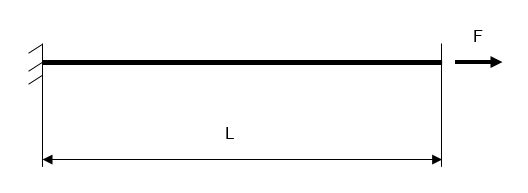
Figure 1.
Bar dimensions are 10 x 10 x 200 mm. Strain-stress curve of the bar material is
defined by the power law:
(1)
Where,
-
- Strength coefficient.
-
- Must be in the range [0,1].
-
=0
- Material is perfectly plastic.
-
=1
- Material is elastic.
The left end of the bar is clamped and the right end is loaded with force F.
The material properties are:
- Properties
- Value
-
- 530 MPa
-
- 0.26
- Poisson's Ratio
- 0

Figure 2. Corresponded strain-stress curve
Note: Elasticity modulus defined by the first two points of the strain-stress
curve is E=2.67324e+10 Pa.
The study was performed for the following load F values: 20000 N, 25000 N, and 30000
N
Reference Solution
One-dimensional analytical reference solution is described here.
At strain
and stress
, the residual strain is:
(2)
Where,
-
- Total strain in the bar.
-
- Elastic component of the total strain.
-
- Residual strain.
-
- Bar cross-section area.
Then residual displacement at the right end of the bar.
(3)
Results
The bar was modeled as a 3D solid. The left end of the solid was fixed and the right
end loaded with axial force (
Figure 3).

Figure 3.
The following table summarizes the residual deformations results.
| Force F [N] |
SOL Reference, Residual
Displacement [mm] |
SimSolid, Residual Displacement
[mm] |
% Difference |
| 20000 |
3.22 |
3.43 |
6.78% |
| 25000 |
9.16 |
9.172 |
0.13% |
| 30000 |
19.077 |
19.14 |
0.33% |
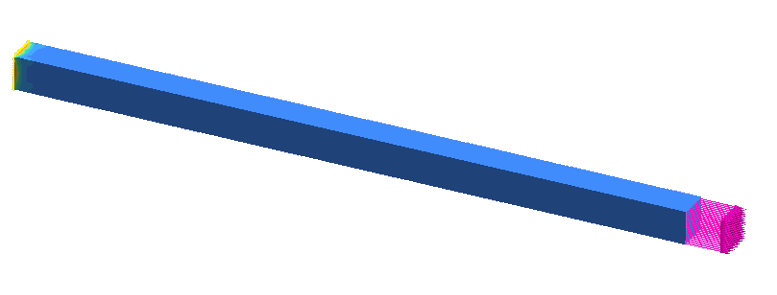
Figure 4. von Mises stress distribution at load F=30000
N