Show Fluids Results
View the results of a Fluids simulation in the Analysis Explorer.
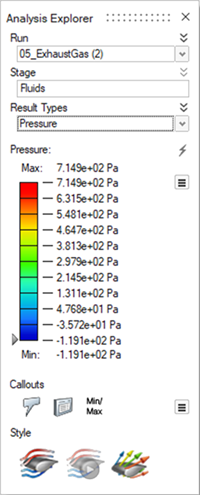
Analysis Explorer Options
The Analysis Explorer includes the following options.
Run
To delete a run from the Analysis Explorer, right-click the run name to select Delete Run.
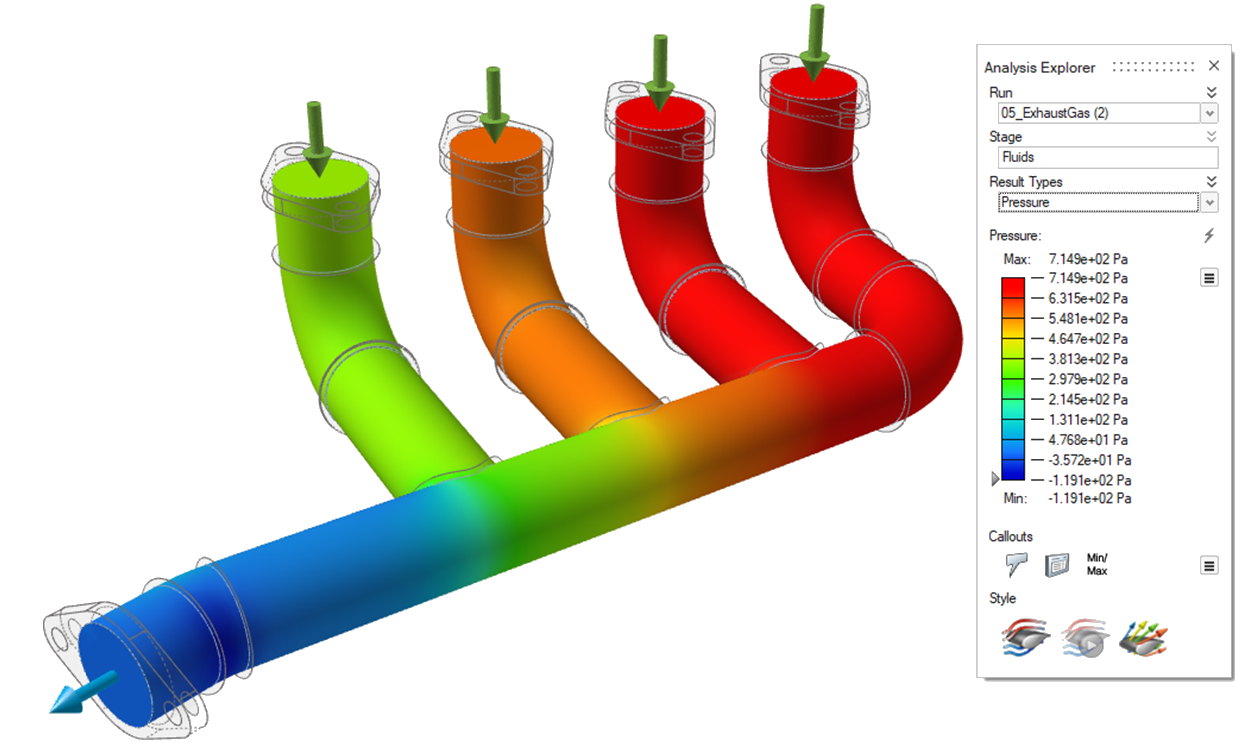
Result Types
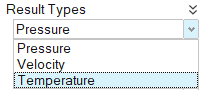
Pressure
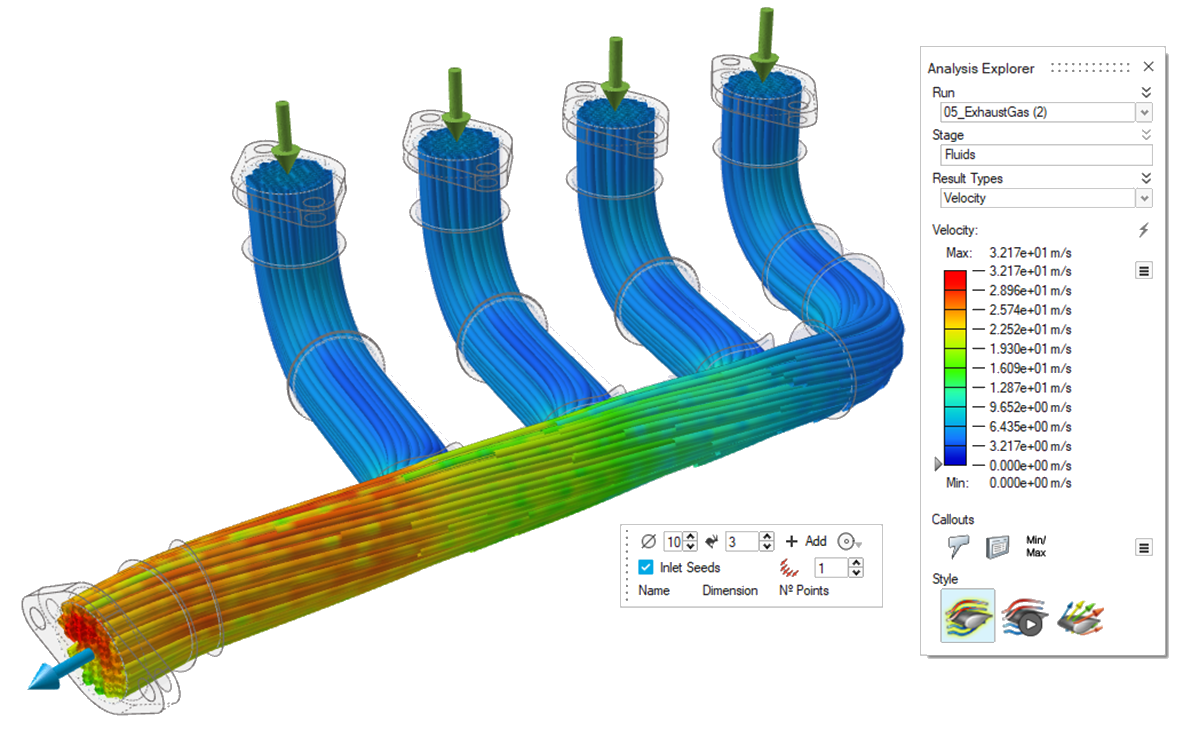
Velocity
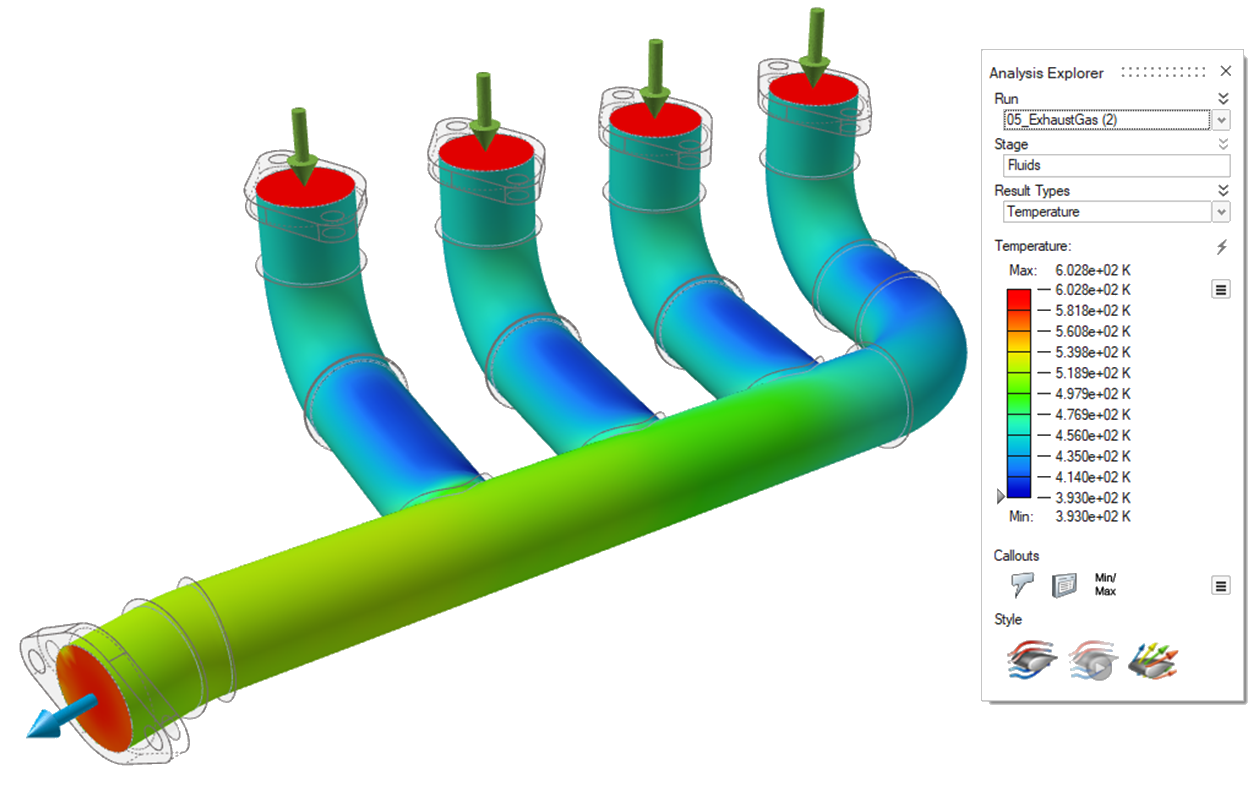
Temperature
Results Slider
| To | Do this |
|---|---|
| Change the upper or lower bound for the results slider | Click the bound and enter a new value. Click the reset button to restore the default values. |
| Filter the results so that areas on the model with results greater than a specified value are masked | Click and drag the arrow on the results slider. To mask areas
with results less than the specified value, click |
| Change the legend color for the result type | Click the |
| Enable the legend's maximum and minimum values to change for each animation step | Click the |
| Reverse the default meaning of results slider colors Note: By default, red indicates high, green
indicates medium, and blue indicates low.
|
Click the |
Show/Hide Elements
When the Analysis Explorer is active, an additional Show/Hide
Elements
![]()
![]() icon appears under the view controls in the lower left
corner of the modeling window.
icon appears under the view controls in the lower left
corner of the modeling window.
Show Options
Determine what is made visible in the modeling window when viewing analysis results. You can show or hide the initial shape, loads and supports, deformation, and contours.
| Option | Description | Note | |
|---|---|---|---|
| Options |
|
||
| Show/Hide Elements | Show/hide the element edges. | This icon appears under the view controls in the lower left of the modeling window, but only when the Analysis Explorer is active. | |
Style Options
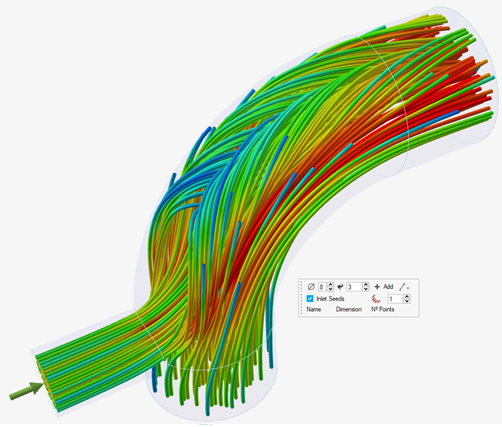
Visualize the results as static streamlines, animated streamlines, or vectors. You can also make edits to the streamlines or vectors.
| Option | Description | Microdialog Options |
|---|---|---|
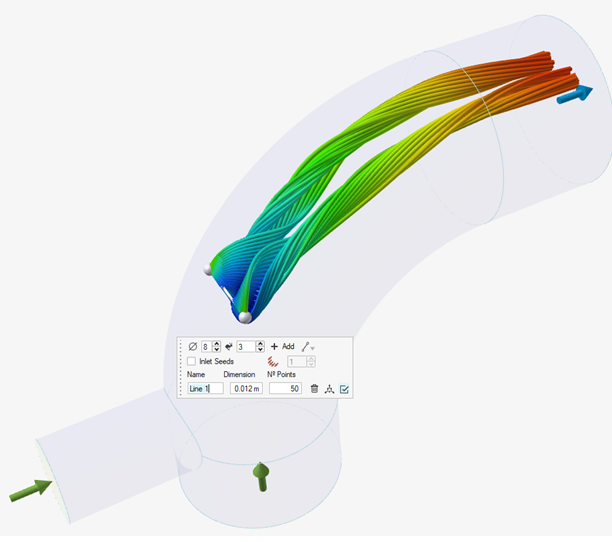
| Static Streamlines |
Visualize the results as static streamlines. In the microdialog, you
can adjust the following parameters:
|
To access the microdialog options for streamlines, select the
Static Streamline icon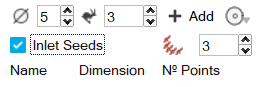
|
| Animated Streamlines |
Only available if Streamlines is turned
on. Click the icon once to visualize the results as animated streamlines. Click the icon again to jump to the end of the animation. 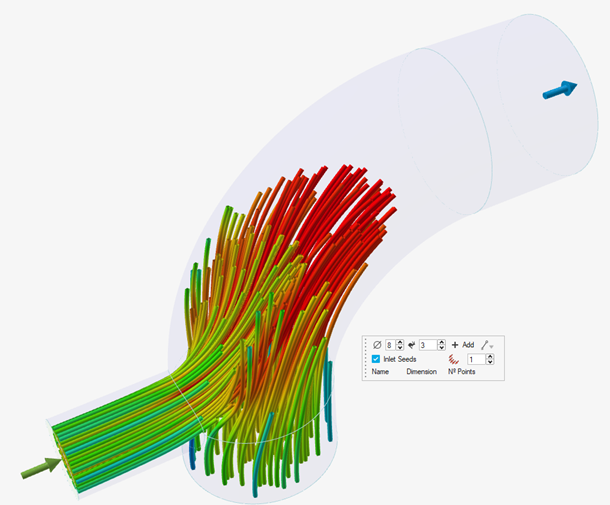
|
|
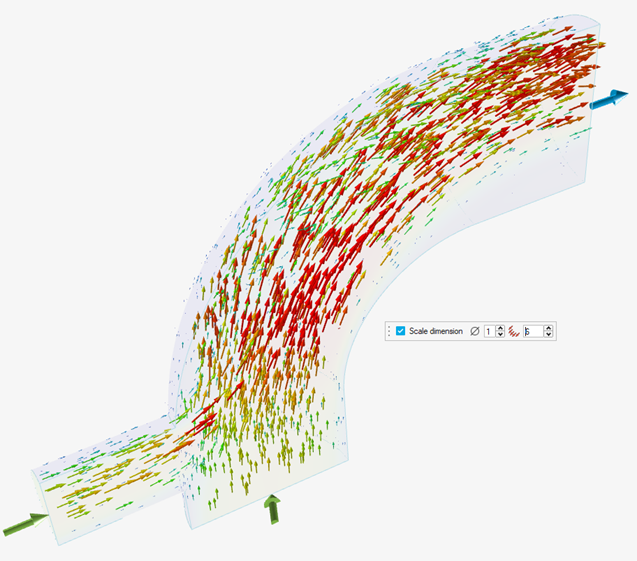
| Vectors |
Visualize the results as vectors. In the microdialog, you can adjust
the following parameters:
|
To access the microdialog options for vectors, select the
Vectors icon 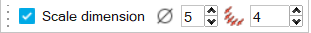
Use the microdialog options to edit the vectors:
|