SnRD Post-Processing proposes two modules: Modal
Contribution and Modal Sensitivity.
Modal Contribution
The E-Line method is a time domain analysis approach, using Modal
Transient Analysis, also known as the Modal Superposition Method. This enables a
transition to the frequency domain.
(1)
Where:
is the time domain displacement.
is the number of modes extracted.
is the Modal displacement
for a mode .
is the Participation
factor for mode .
With all the above responses available in the standard outputs from OptiStruct Analysis, the Relative Modal Contribution [%]
values can be calculated. These will describe the participation of a mode or modes
on a peak of the time domain response.
Figure 1.
Modal Sensitivity
Use modal sensitivity to live perform what-if studies by altering the time domain
response of an E-Point or complete E-Line. This is achieved by
decomposition of the Modal Superposition response, applying a factor (between 0 and
1) on selected modes, damping, and canceling or isolating them.
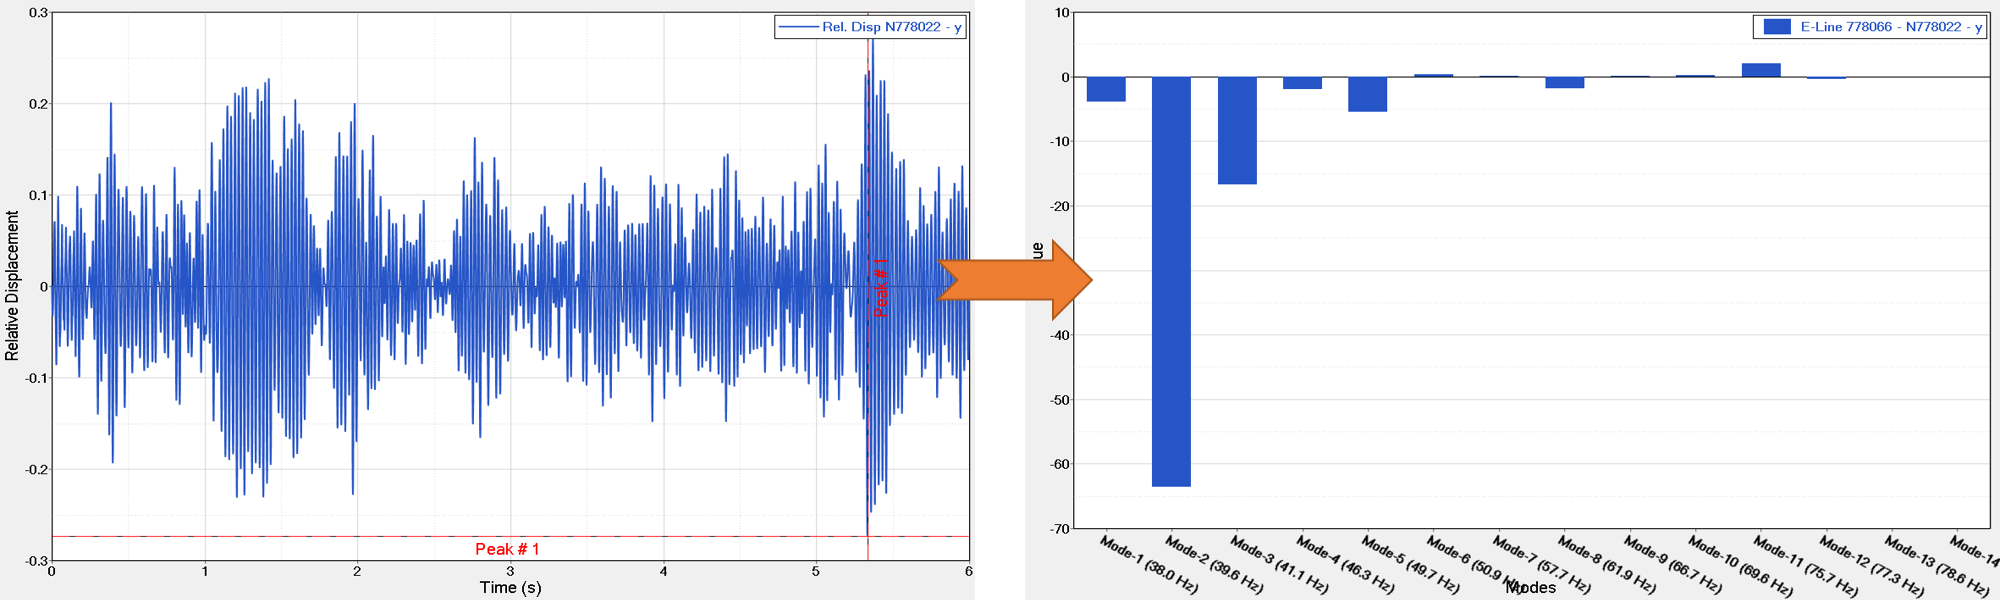 Figure 1.
 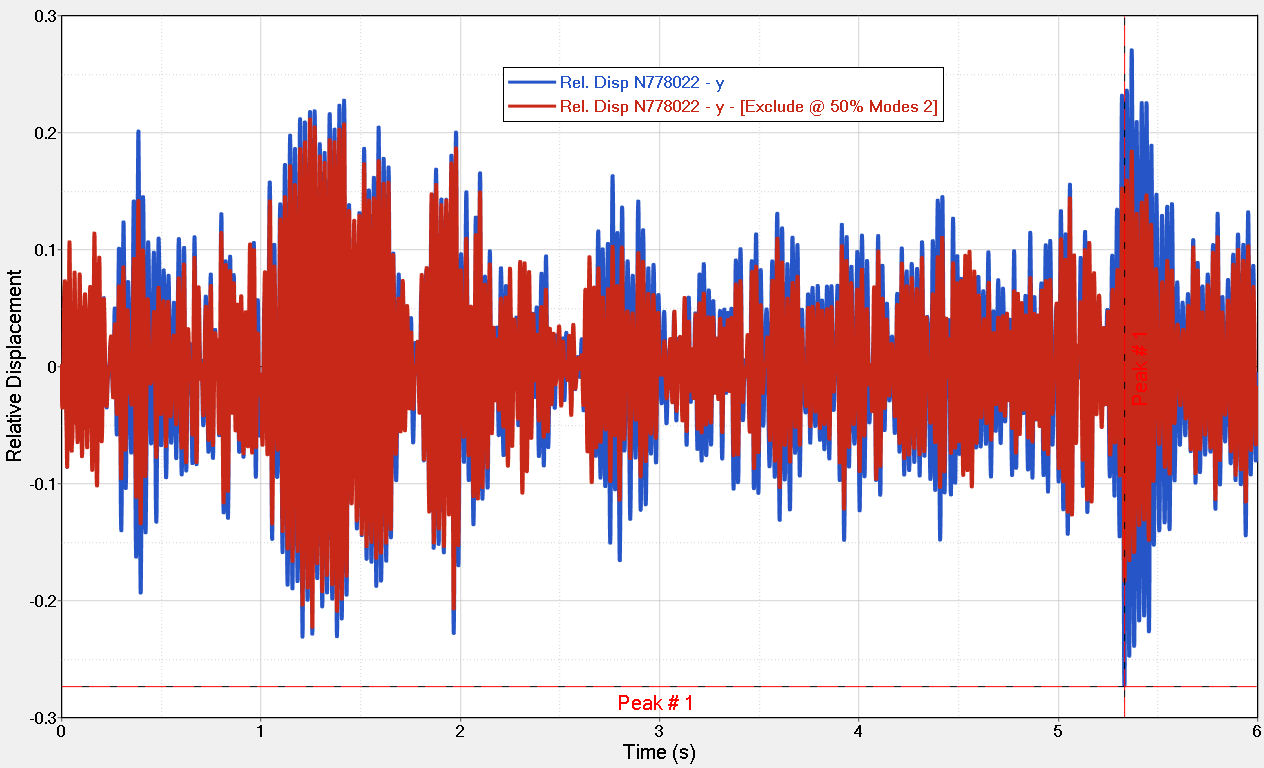 Figure 2.