Import and Plot Flutter Curves
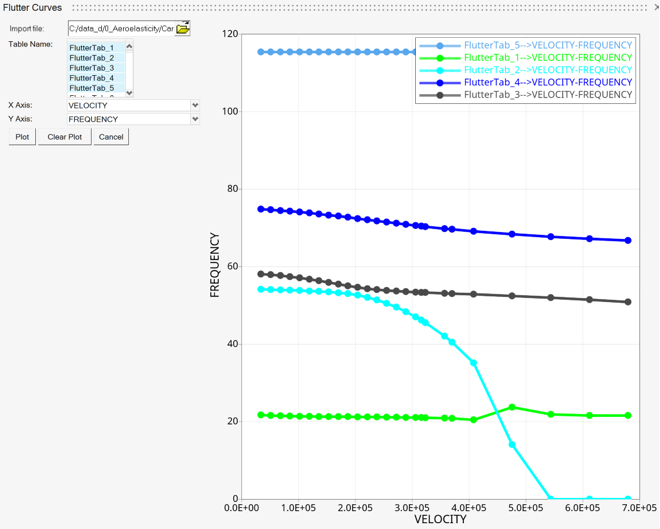
Use the Flutter Curve tool to process flutter data by cross-plotting selected result quantities from the flutter solution results.
View new features for Altair HyperWorks 2023.
Learn the basics and discover the workspace.
Learn more about the Altair HyperWorks suite of products with interactive tutorials.
Start and configure the applications.
View a list of deprecated panels and their newer, equivalent workflows.
Create, open, import, and save models.
Set up sessions and create report templates.
Solver interfaces supported in HyperMesh.
A solver interface is made up of a template and a FE-input reader.
Browsers provide a structured view of model data, which you can use to review, modify, create, and manage the contents of a model. In addition to visualization, browsers offer features like search, filtering, and sorting, which enhance your ability to navigate and interact with the model data.
Create and edit 2D parametric sketch geometry.
Create, edit, and cleanup geometry.
FE geometry is topology on top of mesh, meaning CAD and mesh exist as a single entity. The purpose of FE geometry is to add vertices, edges, surfaces, and solids on FE models which have no CAD geometry.
Explore the different types of mesh you can create in HyperMesh and create and edit 0D, 1D, 2D, and 3D elements.
Create, organize and manage parts and subsystems.
HyperMesh composites modeling.
Create connections between parts of your model.
Rapidly change the shape of the FE mesh without severely sacrificing the mesh quality.
Create a reduced ordered model to facilitate optimization at the concept phase.
Workflow to support topology optimization model build and setup.
Setup an Optimization in HyperMesh.
Multi-disciplinary design exploration and optimization tools.
Validate the model built before running solver analysis.
Models require loads and boundary conditions in order to represent the various physics and/or physical equivalents to bench and in-use testing.
Reduce a full 3D model with axisymmetric surfaces while accounting for imperfections.
Tools and workflows that are dedicated to rapidly creating new parts for specific use cases, or amending existing parts. The current capabilities are focused on stiffening parts.
Tools used for crash and safety analysis.
Use airbag folder utilities and export a resulting airbag in a Radioss deck.
Essential utility tools developed using HyperMesh-Tcl.
Import an aeroelastic finite element model with Nastran Bulk Data format.
Use the Panel Mesh tool to select up to four locations to define the domain for the CAERO1 panel.
Use the Body Mesh tool to define the body type of aerospace meshing called CAERO2.
Use the Engine Mesh tool to define the engine or missile modeling and meshing.
Use the Spline tool to define the coupling/interface between the structure model (through the SET1 entity) and the aero model (through the AELIST entity), respectively called structure and aero surfaces.
Use the Control Surface tool to define controlling surfaces and required data.
Use the Monitor Points tool to define the types of monitor definitions.
Use the Flutter Curve tool to process flutter data by cross-plotting selected result quantities from the flutter solution results.
Use the Aeroelasticity Browser to build a model for three of the aeroelasticity solution sequences for Nastran (MSC) users.
Framework to plug certification methods to assess margin of safety from the model and result information.
Create and evaluate evaluation lines and optimize interfaces to eliminate squeak and rattle issues.
Use PhysicsAI to build fast predictive models from CAE data. PhysicsAI can be trained on data with any physics or remeshing and without design variables.
Results data can be post-processed using both HyperMesh and HyperView.
HyperGraph is a data analysis and plotting tool with interfaces to many file formats.
MotionView is a general pre-processor for Multibody Dynamics.
MediaView plays video files, displays static images, tracks objects, and measures distances.
Use TableView to create an Excel-like spreadsheet.
TextView math scripts reference vector data from HyperGraph windows to automate data processing and data summary.
Create, define, and export reports.
Explore, organize and manage your personal data, collaborate in teams, and connect to other data sources, such as corporate PLM systems to access CAD data or publish simulation data.
Import an aeroelastic finite element model with Nastran Bulk Data format.
Use the Flutter Curve tool to process flutter data by cross-plotting selected result quantities from the flutter solution results.
Use the Flutter Curve tool to process flutter data by cross-plotting selected result quantities from the flutter solution results.

© 2023 Altair Engineering, Inc. All Rights Reserved.
Intellectual Property Rights Notice | Technical Support | Cookie Consent