The Value filter available in the Contour panel allows you to specify threshold
criteria for processing results only in a specific range.
The Value filter discards any values not meeting the specified
criteria. There are three possible modes to specify a criteria: greater than or equal to (>=),
less than or equal to (<=), or a Range. The results will be displayed on entities (like
nodes, elements, or systems) only when the value criteria is met. By default, no filter is
applied (None). The Value filter is similar to that of an iso surface when processing results,
with the difference being that no result is shown for the entities that do not meet the
criteria (instead of removing those entities from display). The Value filter can be a useful
tool for isolating the 'hotspot' areas. Using this filter along with the Count aggregation
mode, allows you to count the number of layers meeting a certain criteria (for example,
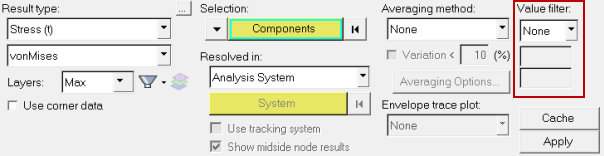
counting the number of plies exceeding a failure index). Figure 1. Contour Panel with Value filter highlighted
The Value filter options (located in the middle of the panel) include:
Mode
Select an option from the drop-down menu:
None (*default setting)
<= (less than or equal to)
>= (greater than or equal to)
Range
Value
Use the field(s) to specify a numerical value or range of values.
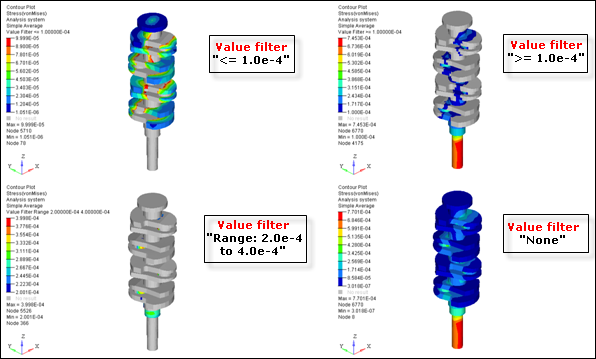
Any entities (nodes/elements/parts/systems) that have values outside of the
filter parameters will be displayed as gray in the graphics area. Figure 2.
The Value filter options can be used in conjunction with the Count and Layer
filter, in order to determine which layers/plies are failing or exceeding certain threshold
criteria.
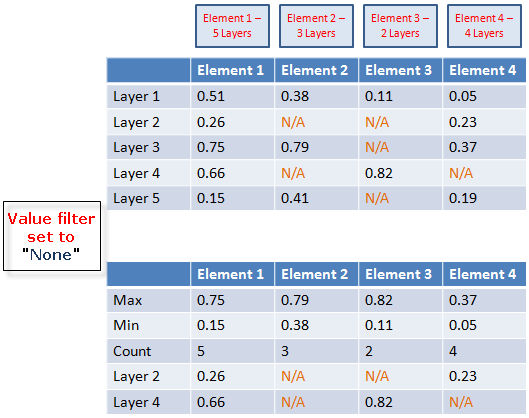
The tables below illustrate how the various Value filter and Layer filter
options work together: Figure 3.
All layers are included in the count and other calculations (Max, Min,
etc.).
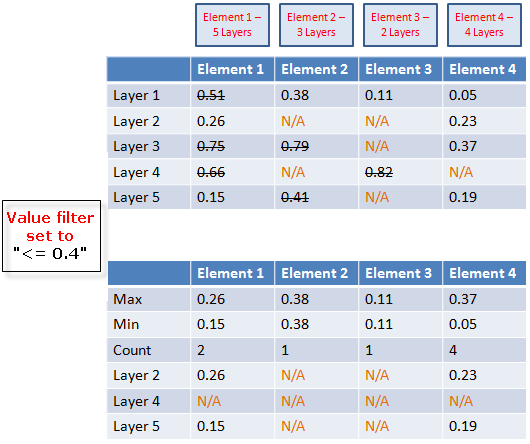
Figure 4.
Only the layers which are less than or equal to 0.4 (the Value filter setting) are
included in the count and other calculations (Max, Min, etc.).
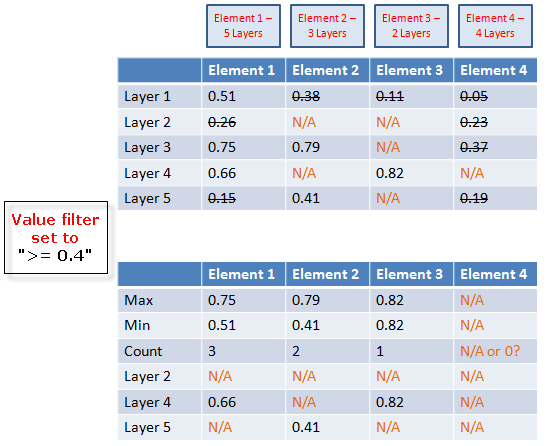
Figure 5.
Only the layers which are greater than or equal to 0.4 (the Value filter setting) are
included in the count and other calculations (Max, Min, etc.).
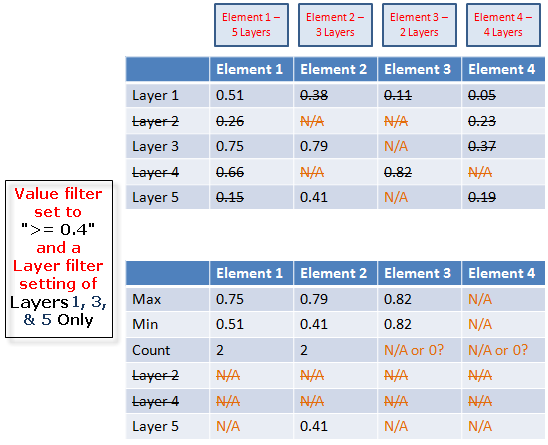
Figure 6.
Only layers 1, 3, and 5 (selected using the Layer filter) which are greater than or
equal to 0.4 (the Value filter setting) and are included in the count and other calculations
(Max, Min, etc.).