Cycle counting is used to extract discrete simple "equivalent" constant amplitude
cycles from a random loading sequence.
Note: For Random Response Fatigue and Sine-Sweep Fatigue, the traditional rainflow
counting method mentioned in this section is not conducted. Instead, the concept
of stress range and number of cycles is inherently taken into account as part of
the fatigue calculation. For more information, refer to Random Response Fatigue Analysis and Sine Sweep Fatigue Analysis.
One way to understand "cycle counting" is as a changing stress-strain versus time
signal. Cycle counting will count the number of stress-strain hysteresis loops and
keep track of their range/mean or maximum/minimum values.
Rainflow cycle counting is the most widely used cycle counting method. It requires
that the stress time history be rearranged so that it contains only the peaks and
valleys and it starts either with the highest peak or the lowest valley (whichever
is greater in absolute magnitude). Then, three consecutive stress points (1, 2, and
3) will define two consecutive ranges as and |. A cycle from 1 to 2 is only extracted if . Once a cycle is extracted, the two points forming
the cycle are discarded and the remaining points are connected to each other. This
procedure is repeated until the remaining data points are exhausted.
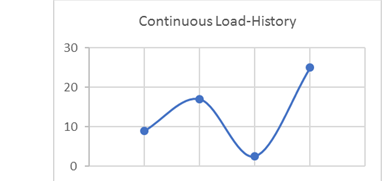
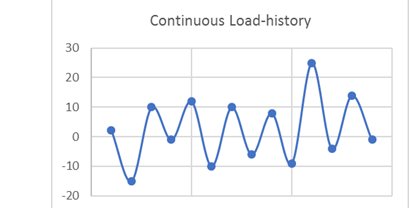
Simple Load
History: Figure 1. Continuous Load History
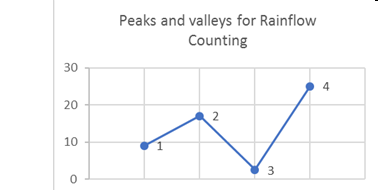
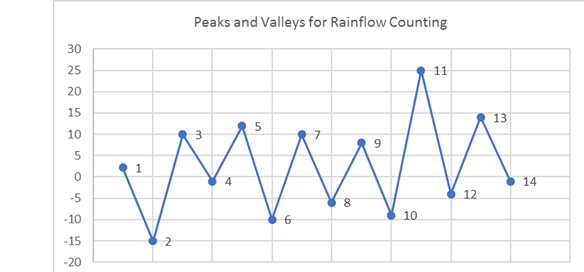
Since this load history is continuous, it is converted into a load
history consisting of peaks and valleys only. Figure 2. Peaks and Valleys for Rainflow Counting. 1, 2, 3, and 4 are the four peaks and valleys
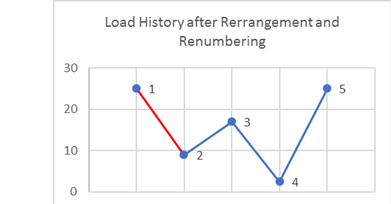
It is clear that point 4 is the peak stress in the load
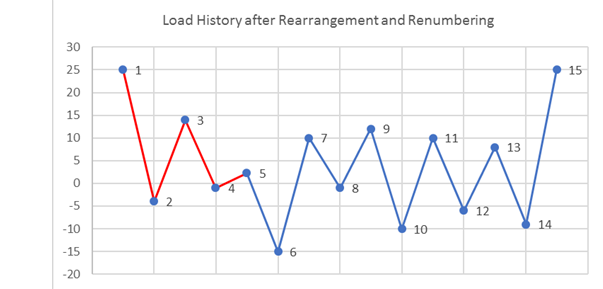
history, and it will be moved to the front during rearrangement (Figure 3). After rearrangement, the
peaks and valleys are renumbered for convenience. Figure 3. Load History after Rearrangement and Renumbering
Next, pick the first three stress values (1, 2, and 3) and
determine if a cycle is present.
If represents the stress value, point then:(1)
(2)
As you can see from Figure 3, ; therefore, no cycle is extracted from
point 1 to 2. Now consider the next three points (2, 3, and 4).(3)
(4)
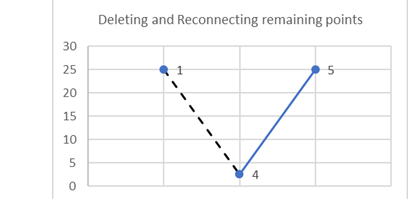
, hence a cycle is extracted from point 2
to 3. Now that a cycle has been extracted, the two points are deleted
from the graph. Figure 4. Delete and Reconnect Remaining Points
The same process is applied to the remaining points:(5)
(6)
In this case, , so another cycle is extracted from
point 1 to 4. After these two points are also discarded, only point 5
remains; therefore, the rainflow counting process is completed.
Two cycles (2→3 and 1→4) have been extracted from this load
history. One of the main reasons for choosing the highest peak/valley
and rearranging the load history is to guarantee that the largest cycle
is always extracted (in this case, it is 1→4). If you observe the load
history prior to rearrangement, and conduct the same rainflow counting
process on it, then clearly, the 1→4 cycle is not extracted.
Complex Load
History
The rainflow counting process is the same regardless of the
number of load history points. However, depending on the location of the
highest peak/valley used for rearrangement, it may not be obvious how
the rearrangement process is conducted. Figure 7 shows just the
rearrangement process for a more complex load history. The subsequent
rainflow counting is just an extrapolation of the process mentioned in
the simple example above, and is not repeated here. Figure 5. Continuous Load History
Since this load history is continuous, it is converted into
a load history consisting of peaks and valleys only: Figure 6. Peaks and Valleys for Rainflow Counting
Clearly, load point 11 is the highest valued load and
therefore, the load history is now rearranged and renumbered. Figure 7. Load History After Rearrangement and Renumbering
The load history is rearranged such that all points
including and after the highest load are moved to the beginning of the
load history and are removed from the end of the load
history.
Parameters affecting rainflow cycle counting may be
defined on a FATPARM Bulk Data Entry. The appropriate
FATPARM Bulk Data Entry may be referenced from a
fatigue subcase definition through the FATPARM
Subcase Information Entry.