View Controls
Use the View toolbar to control the view and display of your plot, the curve color display, and plot curves instantly.
Fit Options
- From the View toolbar, click
 .
. - From the pop out menu:
- Click
 to fit x data only within the viewable
graphics area.
 - Click
 to fit y data only within the viewable
graphics area.
- Click
- Click
 to flip x and y data.
For Bar Charts, this option flips the axes and creates horizontal category labels.
- Click
 to enable Curve Inspect
Mode.
Curve Color Mode
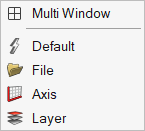
From the View toolbar, use the curve color mode options to change curve colors.Select to display the following options:
- Multi Window
- Click the multi window icon to change the color modes across multiple windows in a page with a single click.
- Default
- Adopt the default curve colors. A separate color is displayed for each curve in the window.
- File
- Change color modes across multiple windows on a page or a single window based on the file name, rendering one color for all curves.
- Axis
- Change color modes across multiple windows on a page or single window based on the axis color. If multiple axes exist, the curve color is changed with the axis color.
- Layer
- Change color modes across multiple windows on a page or a single window based on a report template. If multiple report templates exist, one color for each curve in a report is rendered.
Dynamic Results Plotting
From the View toolbar, click Dynamic results plotting, ![]() , to
plot curves instantly while the solver is running. When selected, the following
micro dialog is displayed:
, to
plot curves instantly while the solver is running. When selected, the following
micro dialog is displayed:

Figure 2. Dynamic Results Plotting microdialog
From the micro dialog, you can change the time interval to plot the results. HyperGraph updates the results dynamically based on the time interval selected.
- From the View toolbar, click
 .
. - In the For Every field, enter a value or click the up or down arrows to increase or decrease the refresh interval value by 10.
- Click
 to apply the changes or
  to reset the defaults.
