Browsers provide a structured view of model data, which you can use to review, modify, create, and manage
the contents of a model. In addition to visualization, browsers offer features like search, filtering, and sorting,
which enhance your ability to navigate and interact with the model data.
FE geometry is topology on top of mesh, meaning CAD and mesh exist as a single entity. The purpose of FE geometry
is to add vertices, edges, surfaces, and solids on FE models which have no CAD geometry.
Tools and workflows that are dedicated to rapidly creating new parts for specific use cases, or amending existing
parts. The current capabilities are focused on stiffening parts.
Use PhysicsAI to build fast predictive models from CAE data. PhysicsAI can be trained on data with any physics or
remeshing and without design variables.
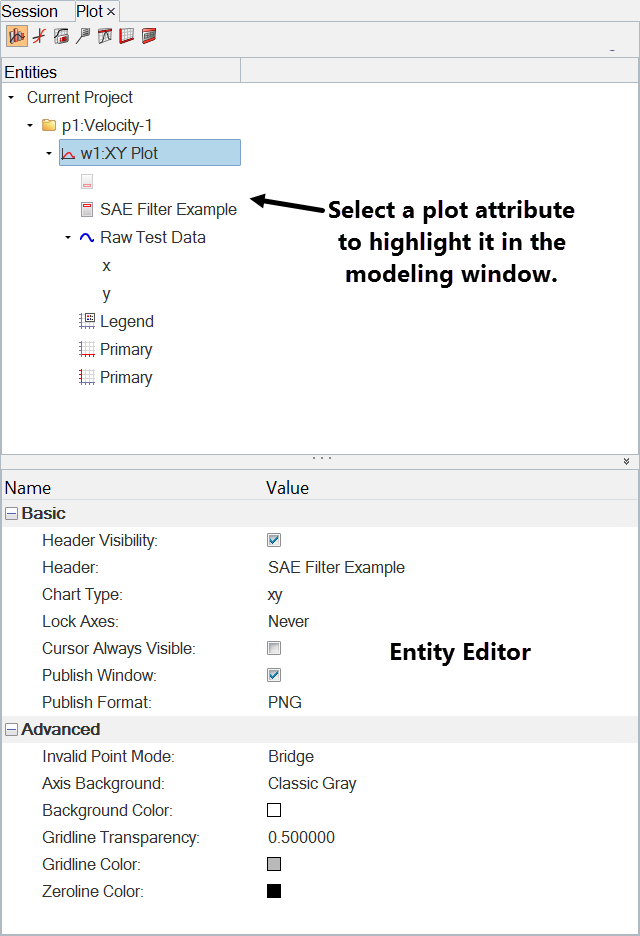
When a plot entity is selected from the plot browser tree, its properties and values are displayed in the Properties
Table, also referred to as the Entity Editor. The fields displayed in the Properties Table are dependent on the curve or entity type selected from the Plot Browser tree.
Explore, organize and manage your personal data, collaborate in teams, and connect to other data sources, such as
corporate PLM systems to access CAD data or publish simulation data.
The HyperGraphPlot Browser is located in the tab area sidebar and allows you to view
the HyperGraph plot structure.
The Plot Browser tools allow you to search, display, and edit
plot data within the current session. From the Plot Browser, you
can select entities one at a time or several simultaneously using common selection
techniques. You can also use the Plot Browser's
context-sensitive menus to select entities. Many of the operations found in the
HyperGraph panels can be performed in the Plot Browser, thus allowing you to modify your plot and curve
properties in one location. Some of these operations include:
Perform single curve math and multiple curve math operations.
Rename curves.
Modify or delete curve properties, such as:
Curve attributes
Legends
Notes
Datum Lines
Axes
Plot options
Plot macros
The Plot Browser can be turned on or off using the View > Plot Browser
menu option. A check mark indicates that the Plot Browser is activated for display in the tab area.
Note: Click and drag the Plot Browser to reposition
it elsewhere in the interface.
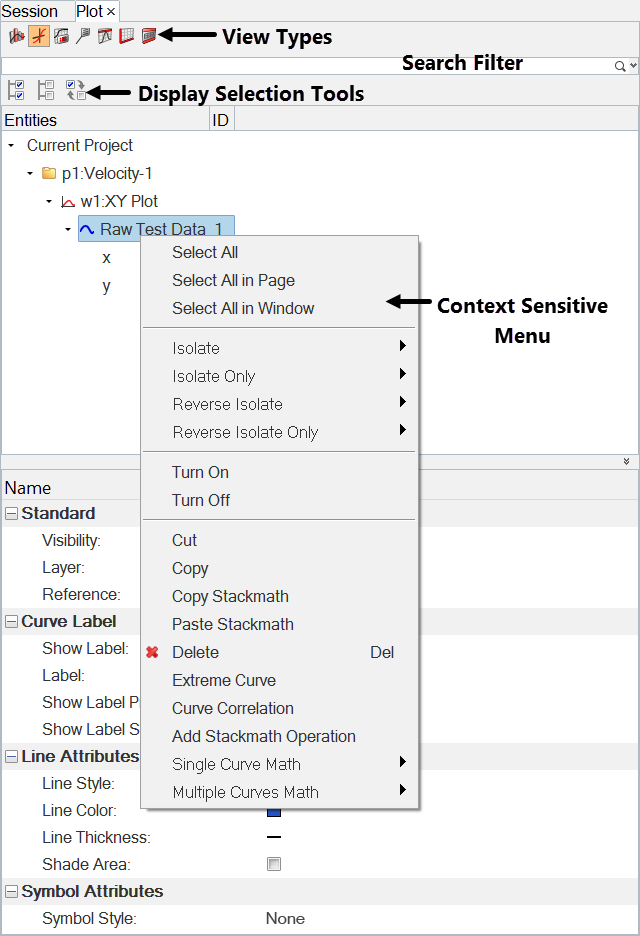
The following options can be used to change the display state of various entities in
the Plot Browser tree.
Select All
Selects all entities shown in the tree.
Select None
Clears all entity selections shown in the tree.
Reverse Selection
Reverses the state of the items in the tree (displays the hidden and hides
the displayed).
Plot Browser Views
Within the Plot Browser, there are seven predefined browser view modes, accessible via the first row of icons within the Plot Browser.
Plot Browser Filter
The Plot Browser contains several ways to filter your plot data to display specific plot entities in the browser.
Plot Browser Context Sensitive Menu
From the Plot Browser, right-click on a highlighted entity to access the following context sensitive menu options.
Properties Table/Entity Editor
When a plot entity is selected from the plot browser tree, its properties and values are displayed in the Properties Table, also referred to as the Entity Editor. The fields displayed in the Properties Table are dependent on the curve or entity type selected from the Plot Browser tree.
Curve Name Properties
The Properties option gives you more control over how the curve names appear in the plot legend.