Edit
Edit curves within a specified range and orientation.
-
From the Line Chart ribbon, click the Edit tool.
The Edit guide bar is displayed.
 Figure 1.
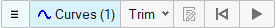
Figure 2. Edit guide bar -
Define the range to edit the curve data using one of the following
methods:
-
From the Options menu,
 , enter From and
To values to define the range.
Important: If Interpolate is selected, a point is inserted using the From or To values, otherwise, the closest point is found for the selected curves based on the From/To values.
, enter From and
To values to define the range.
Important: If Interpolate is selected, a point is inserted using the From or To values, otherwise, the closest point is found for the selected curves based on the From/To values. -
Click the slider bar to display a micro dialog that contains the slider
bar's current position. Enter a new value in the X field to move the
slider bar.
From the microdialog, select the slider mode. Once selected, click the arrow to move the slider bar.
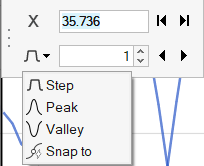
Figure 3. Edit guide bar microdialog- Step
- Moves the slider bar to the step value specified in the field.
- Peak
- Moves the slider bar to the next highest point on the curve.
- Valley
- Moves the slider bar to the next lowest point on the curve.
- Snap To
- Snap To forces the range values to be existing points on the selected curve. Move the range bars on the screen to find the curve point.
-
From the Options menu,
-
Click Proceed,
 , to
complete the action.
Note: From the Plot Browser, select the edited curve(s) to view the action performed and its related data.
, to
complete the action.
Note: From the Plot Browser, select the edited curve(s) to view the action performed and its related data.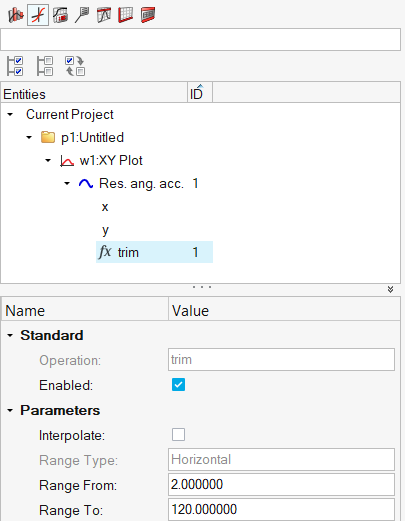
Figure 4.Tip: To display the Edit guide bar from the Plot Browser, select a curve, right-click and select Edit Curves. -
Click Reset,
 , to
reset the guide bar options.
, to
reset the guide bar options.