Create and Edit Curves
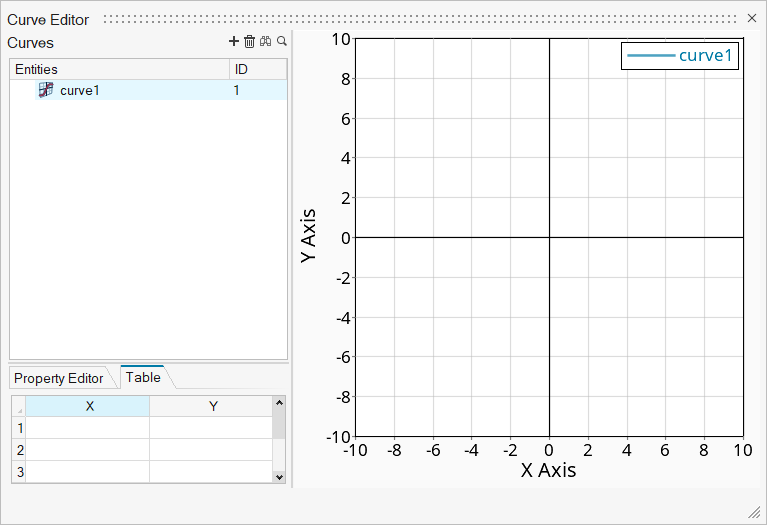
Use the curve editor to create and plot XY curves.
Import Data From a CSV File
Export Data To a CSV File
Edit Points On a Curve
Curve Operations
Property Editor
You can change various attributes of the plot by clicking the Property Editor tab:
- Visibility
- When checked, displays the curve.
- Layer
- When report templates are overlayed, each overlayed curve is stored in a different layer.
- Reference
- The curve (and shading, if areas are shaded) moves behind the grid lines of the plot, so that the grid lines are visible over the curve/shading. Autofit does not apply to the curve.
- Show Label
- Displays the name of the curve in the upper-right corner of the graph.
- Label
- The name of the curve.
- Show Label Prefix
- Displays a prefix before the name of the curve in the label.
- Show Label Suffix
- Displays a suffix after the name of the curve in the label.
- Line Style
- Options for displaying various line types.
- Line Color
- Change the color of the curve.
- Line Thickness
- Change the thickness of the curve.
- Shade Area
- Provides options for shading parts of the graph in relation to the curve.
- Symbol Style
- Provides options for adding a symbol to the curve label. You can set the style, color, frequency, and size of the symbol.


