Modify Results Plot
Adjust the display attributes for the results plot.
-
On the Analysis Workbench
toolbar, click
 (Results plot).
-
In the drop-down menu, click the desired plot.
The Legend dialog will open, and the chosen contour plot will appear in the modeling window.
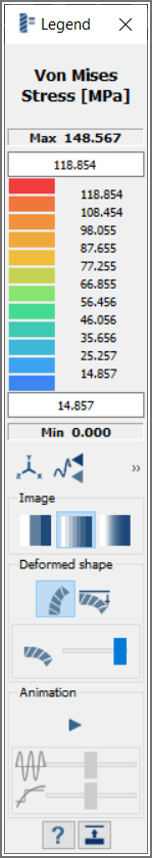
Figure 1. -
Control the contour bounds.
-
Use the Max and Min text
boxes to set upper and lower contour bounds.
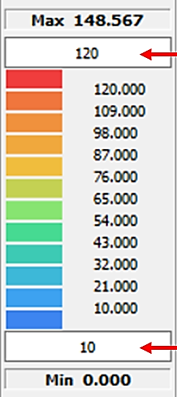
Figure 2. -
Use Set Output Coordinate System
 to visualize the
change in results based on the local coordinate system created.
to visualize the
change in results based on the local coordinate system created.
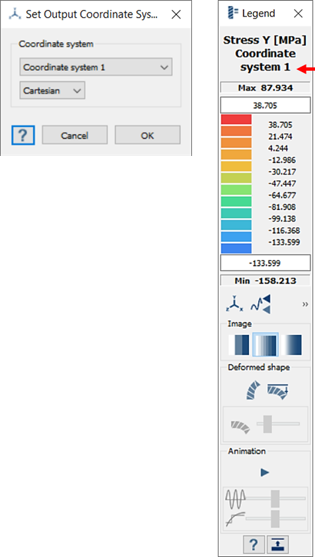
Figure 3.Note: Set Output Coordinate System works for static, modal, and dynamic analysis. -
Click
 to show the maximum and
minimum labels in the modeling window.
to show the maximum and
minimum labels in the modeling window.
-
Click
 to
lock the maximum and minimum contour bounds.
to
lock the maximum and minimum contour bounds.
-
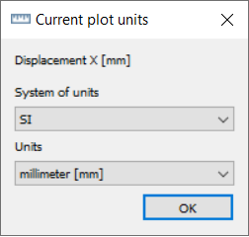
Use Set Output Units
 based
on the requirements to visualize the legend magnitude. The units are
shown with respect to the type of result selected.
based
on the requirements to visualize the legend magnitude. The units are
shown with respect to the type of result selected.
-
Use the Max and Min text
boxes to set upper and lower contour bounds.
-
Use the
 icon to show deformed shapes in the modeling window.
-
Change deformation scale factor.
-
Click the
 (Change max deformation) icon.
- In the dialog, clear the Default check box and either adjust the slider, enter a scale value into the text box, or use the arrows to increment the scale factor as desired.
- Optional: Clear the Default check box and enter a scale value of 1.0 to set deformation to true scale.
-
Click the
-
View/adjust the Animation.
-
Click the
 icon to play the animation.
The slider will show the current frame of the animation:
icon to play the animation.
The slider will show the current frame of the animation:
Figure 4. -
Click the
 icon to stop the animation.
-
Use the Animation Speed and Animation
Step sliders to adjust the speed and frames displayed in
the animation.
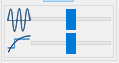
Figure 5.Note: These sliders will only be active when the animation is playing.
-
Click the